- China reining in liquidity has been less severe than expected
- Communist Party’s centennial in July seen a boon for stocks
China’s stocks burst out of a tight trading range this week, and that may just be the start given the bullish signs for the market that have been forming under the hood.
China’s equity benchmarkjumped3.2% on Tuesday, the most since July as investors piled into stocks amid attempts bypolicymakers tocontaincommodity prices.
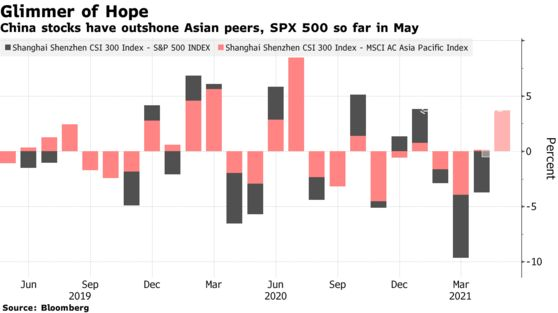
But even before that, momentum was showing signs of gathering. The benchmark CSI 300 Index has staged the largest monthly outperformance against the S&P 500 Index and MSCI Asia Pacific Index since at least January this month, while the Shanghai Composite is poised for its best May performance since 2013.
Here are four charts showing signs of bullishness for Chinese stocks.
Fear Fades
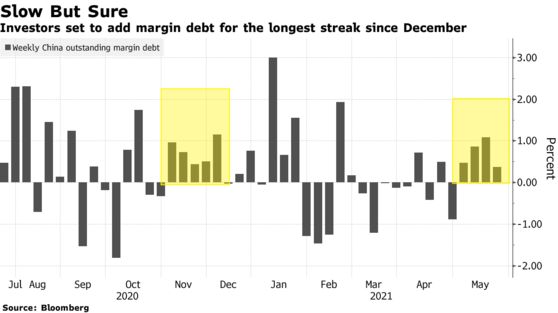
China’s stock traders have been taking on more leverage in the past three weeks. While the increase in percentage terms doesn’t compare to earlier this year when the CSI 300 soared to near a record, the streak is set to be the longest since December ahead of a gradual build-up tothe peak. The total value of margin debt in Shanghai and Shenzhen climbed to 1.54 trillion yuan on Monday, the highest since late January, as risk appetite crept back.
Sentiment Thaws
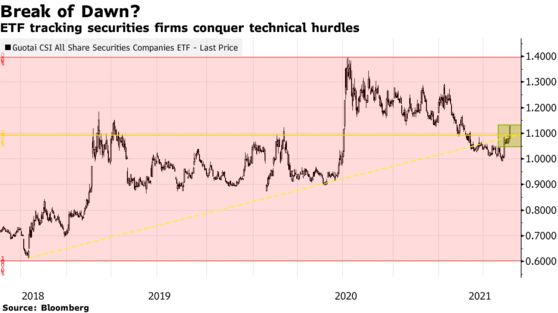
An exchange-traded fund that tracks a basket of the nation’s brokerage stocks -- long known as the flag bearers of a bull market -- has just formed a bullish breakout, giving sentiment a leg up after lying dormant for months.Brokerages, which tend to pick up in volatility before a rally actually starts, are favored by those with high risk preference for their high volatility and ability to outperform times of exuberance, like the one seen in July last year.
Return of Momentum
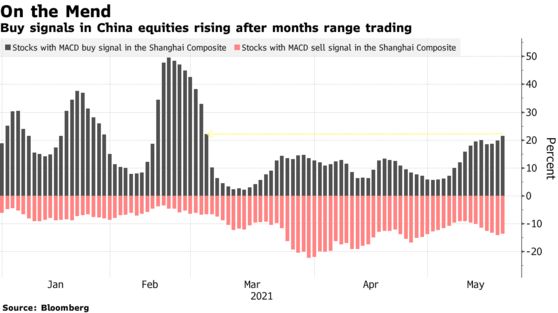
While the CSI Index’s trades are largely contained within a trading envelope, at least one indicator tells a different story. The percentage of shares with a buy signal based on the moving-average convergence-divergence pattern has recovered to the highest level since early March. Those with a sell signal are on a declining trend.
Early Beams
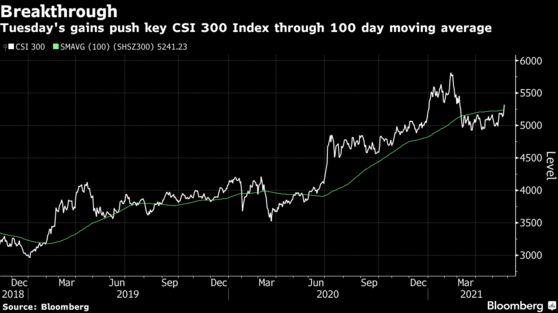
On Tuesday, the index broke through its 100-day moving average threshold, a support that was last breached in March, in another bullish signal. But that comes after a more important support level for investors in China.
That’s because onshore, the gauge of some of the nation’s largest and leading firms has also broken through its 60-day, or approximately two-month moving average for eight sessions, a sign often taken by traders to mark the bull-bear divide.
While market watchers are careful not to get overly excited, some are ready to embrace the positive signs.
“Onshore liquidity has not tightened nearly as quickly as feared earlier this year, and this could be a rare window of opportunity this year to go long on stocks,” said Zhang Chuanxu, fund manager at Hexi Capital in Shanghai. “But I’m still reluctant to call it the start of a full blown rally just yet.”
精彩评论