Summary
- Even after fading from the late January peak, the VIX Index ended the month 45% above where it started. That jump represents the largest month-over-month increase since the fall of 2018.
- Technical dislocations may continue to cause short-term disruptions, but two factors favor a further drop in equity volatility: an improving economy and exceptionally easy monetary conditions.
- Economic surprise indexes remain solidly in positive territory, suggesting most economic data is beating expectations.
Despite a stellar 2020, market momentum did not survive January. After a strong start, stocks surrendered gains as investors tried to process triple-digit volatility in a handful of small-cap, heavily shorted names.
While the damage to markets was minimal, the boost to volatility was not. Even after fading from the late January peak, the VIX Index ended the month 45% above where it started. That jump represents the largest month-over-month increase since the fall of 2018.
While volatility has started to fade, the VIX Index and other measures of equity volatility remain well above their long-term average. Technical dislocations may continue to cause short-term disruptions, but two factors favor a further drop in equity volatility: an improving economy and exceptionally easy monetary conditions.
Starting with the economy, while a few economic indicators have softened there is ample evidence that the economy continues to improve. Economic surprise indexes remain solidly in positive territory, suggesting most economic data is beating expectations. With the vaccine rollout accelerating and more stimulus on the way, I would expect further improvement.
The second factor favoring lower volatility is easy money. Regardless of the precise metric - credit spreads, money supply growth, real interest rates - money has rarely been this cheap or available. This combination of an improving economy and favorable financial conditions typically coincides with low volatility.
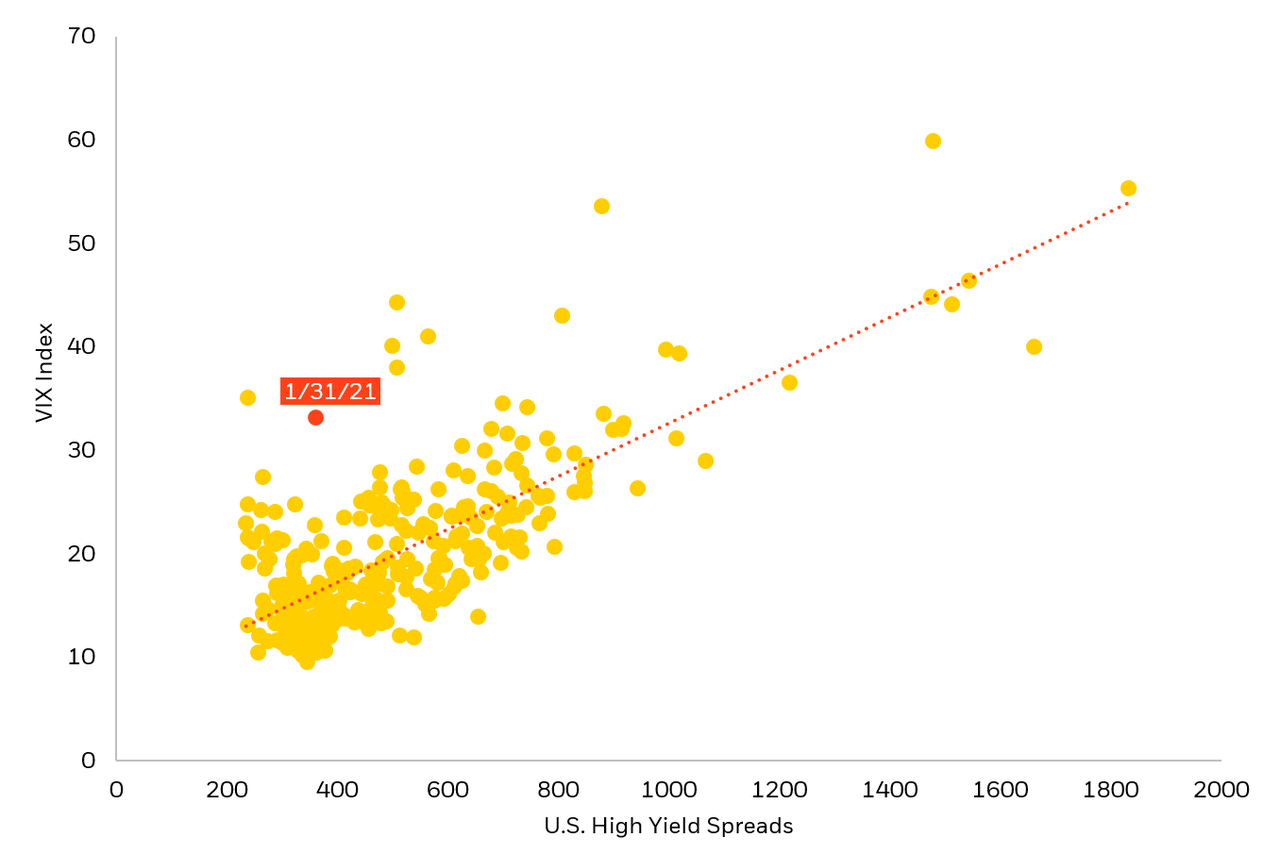
For example, a simple one-factor model using credit spreads as a proxy for financial conditions explains about 55% of the variation in the VIX Index (see Chart 1). Based on this relationship, volatility is still way too high. As credit markets proved resilient during the recent sell-off, high yield spreads remain tight. Narrow spreads suggest the VIX should be trading closer to 15 than 25. Looking at different measures and combinations of factors leads to a similar conclusion: Equity volatility has further to fall.
High yield spreads vs VIX Index 1994 to present
Lower Volatility = Cyclicals > Defensives
Easy money and an improving economy suggest not only lower volatility but further equity gains. That said, those gains are not likely to be shared equally.
Assuming volatility continues to grind lower, history suggests favoring cyclical over defensive stocks. Based on 20 years of data, when the VIX is falling the MSCI Cyclical - Defensive Return Spread Index posts an average monthly gain of around 1%. When the drop in volatility is large, 10% or more, average cyclical outperformance expands to nearly 2%.
Given this dynamic, I would continue to favor cyclical expressions including machinery, specialty chemicals, and cyclical parts of technology. At the same time, I would remain underweight the more overpriced parts of consumer staples, particularly household and food products. For investors, the conclusion is not just to maintain equity exposure, but to favor those parts of the market most likely to benefit from a normalization of both the economy and (hopefully) financial markets.
精彩评论