US STOCKS, WALL STREET, S&P 500 TECHNICAL ANALYSIS – TALKING POINTS:
- S&P 500 idling after touching another record high
- Negative RSI divergence warns momentum ebbing
- Pullback would put support below 4300 into focus
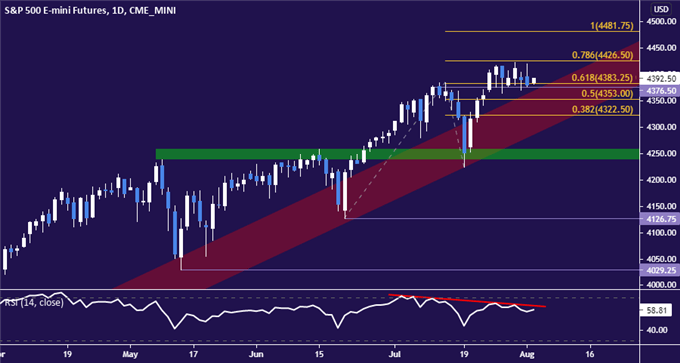
The broad-based S&P 500 benchmark equity index has settled into a consolidative range centered around the 4400 figure after putting in yet another record high. Acutely negative RSI divergence suggests upside momentum is unraveling, which may lay the groundwork for a reversal downward.
The 50% and 38.2% Fibonacci expansions at 4353.00 and 4322.50 approximate near-term support in the event that prices push through the range floor at 4376.50. Building the case for major topping and lasting follow-through probably demands a daily close below resistance-turned-support in the 4238-58 zone.
On the topside, the 78.6% expansion at 4426.50 sits just a hair past record highs and effectively marks the outer layer of immediate resistance. Breaking that barrier on a daily closing basis might set the stage for an advance to probe near the 100% Fib at 4481.75.
精彩评论