Summary
- Consistent growth in revenue, net income, free cash flow, but with high debt levels on the balance sheet.
- The company is well-diversified in the revenue sources, which include multiple highly-desired products and services.
- In the next couple of years, sales growth will likely slow compared to the substantial post-pandemic increase in 2021.
- This makes the shares a bit overvalued in the short term but still relatively undervalued in the long run.
The iPhone maker Apple Inc. (AAPL) generates large revenues and free cash flows and will most certainly continue to do so for the foreseeable future. This, however, could already be priced in the company's stock, which makes it susceptible to a price consolidation or slight correction in the short term. This is even more so due to the post-pandemic hefty 2021 revenue increases, which the company is unlikely to sustain in the next year or two.
I have compiled some data from the company's past annual reports in an attempt to forecast the revenues for the next few years, with the ultimate goal of evaluating the current share price. As usual, I will go quickly through the existing financial situation of the company and then move on to more fun stuff.
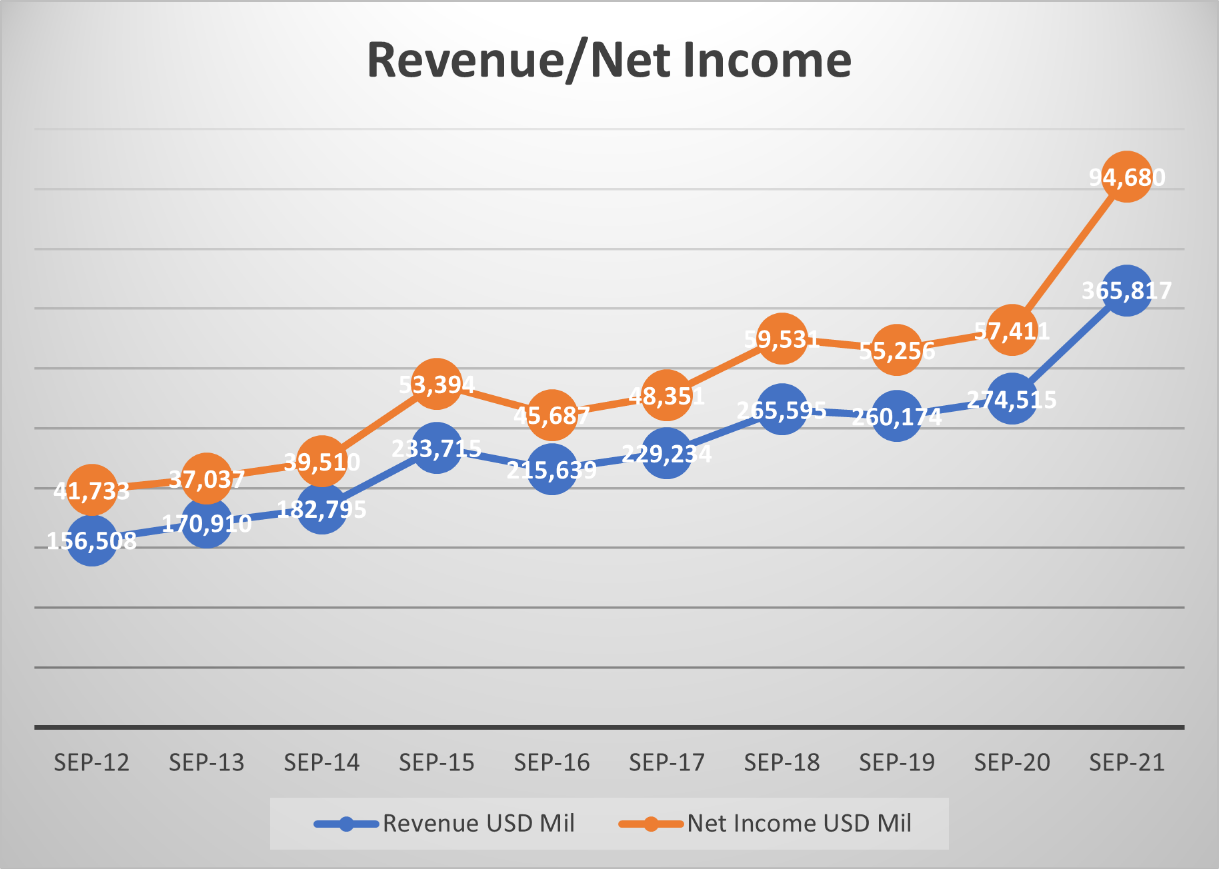
Financials Revenue and Net Income
Apple generates revenues from multiple flagship products and services, including iPhone and iPad sales, App Store, Apple Care services, and cloud storage, to name a few. iPhone sales are the major contributor to revenues, but recently the Other Products category, which includes such items as Apple Watch, Home Air Pods, Home accessories and other wearables, has picked up quite nicely. Apple product users are pretty much locked into the iOS ecosystem and unwilling to part with such products anytime soon. Short of the company successively releasing a few subquality devices, it is not likely Apple's loyal customers will abandon the company anytime soon. This, in turn, will ensure Apple's consistent revenue generation for many more years to come.
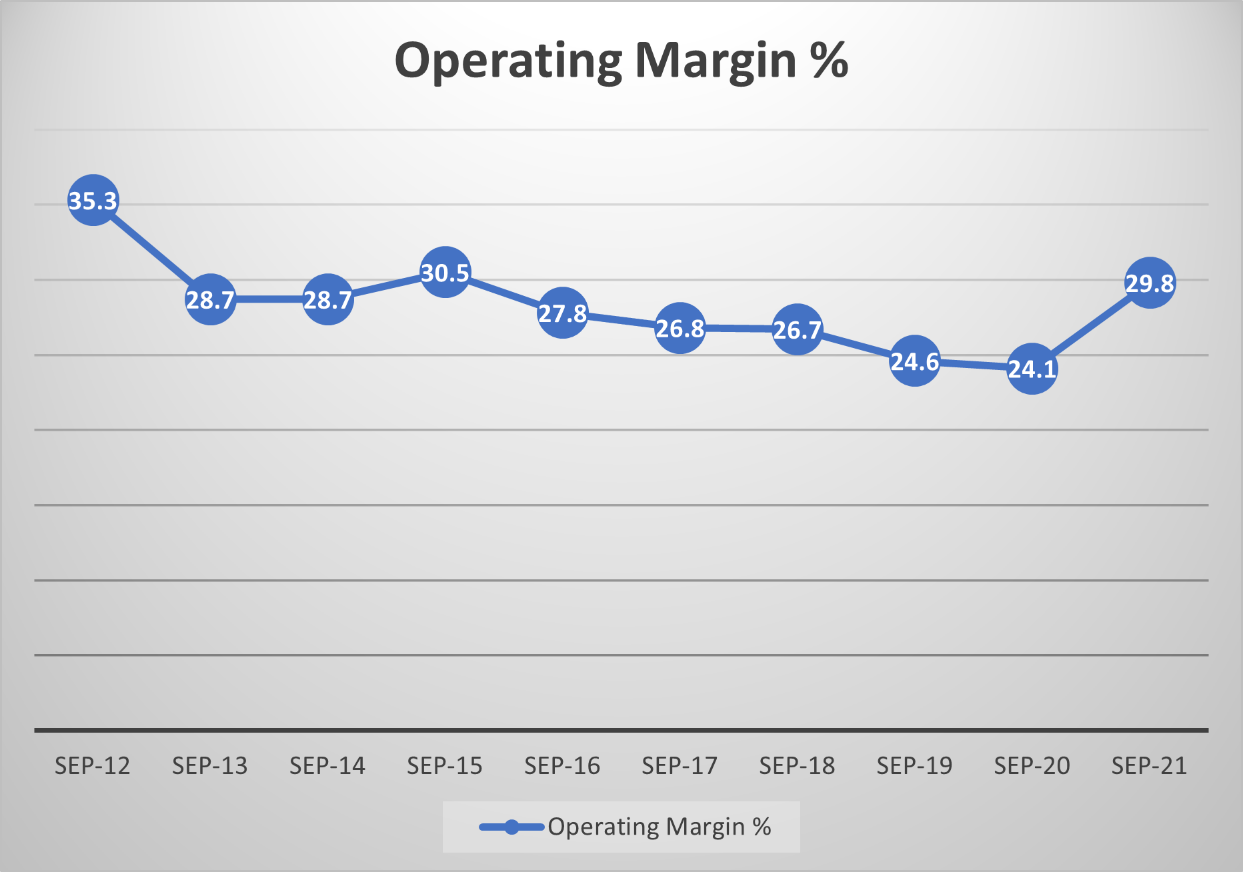
The operating margin is good at over 25%, considering the fierce competition in the tech sector, where margins are always being tested in order to gain market share.
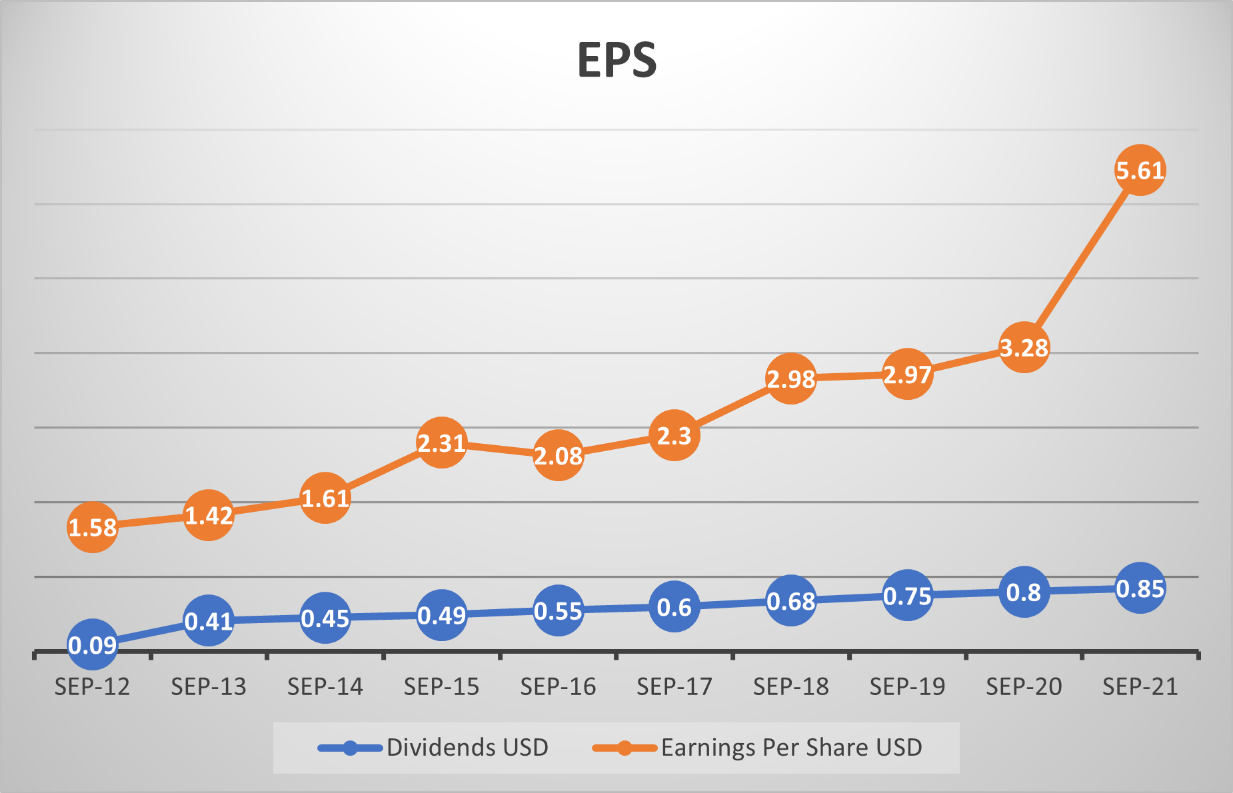
Earnings have seen a sharp increase in 2021 after modest gains over the previous years. The earnings will likely pull back a bit, in line with the trend leading up to the pandemic. The dividend yield is relatively low when compared to many other tech giants.
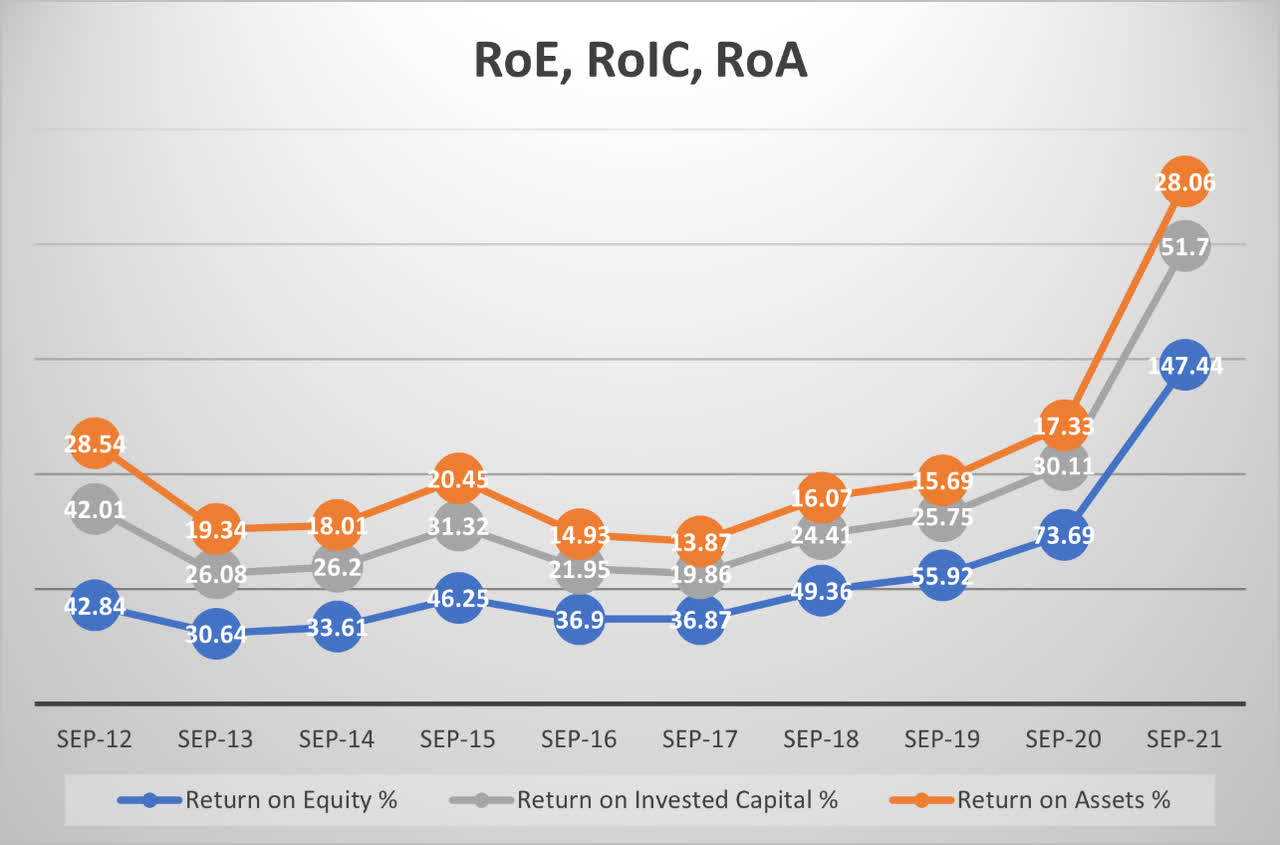
Return on Equity, Return on Invested Capital, and Return on Assets
The same can be observed with the return on equity, invested capital, and assets. All these three metrics have seen a jump in the last year, with the return in equity being the highest.
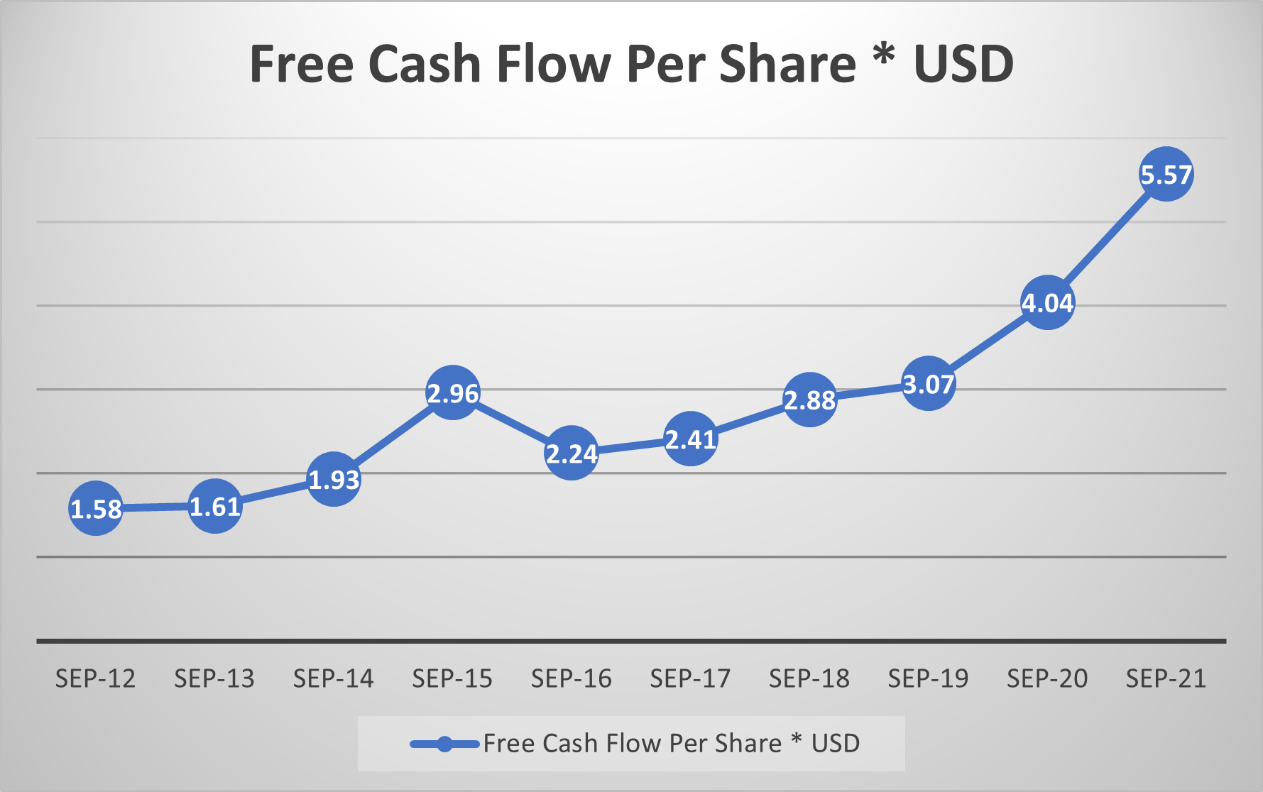
The free cash flow per share is illustrated in the chart below. The growth is steady as the company can generate a lot of cash due to the popularity of its products.
Financial Health
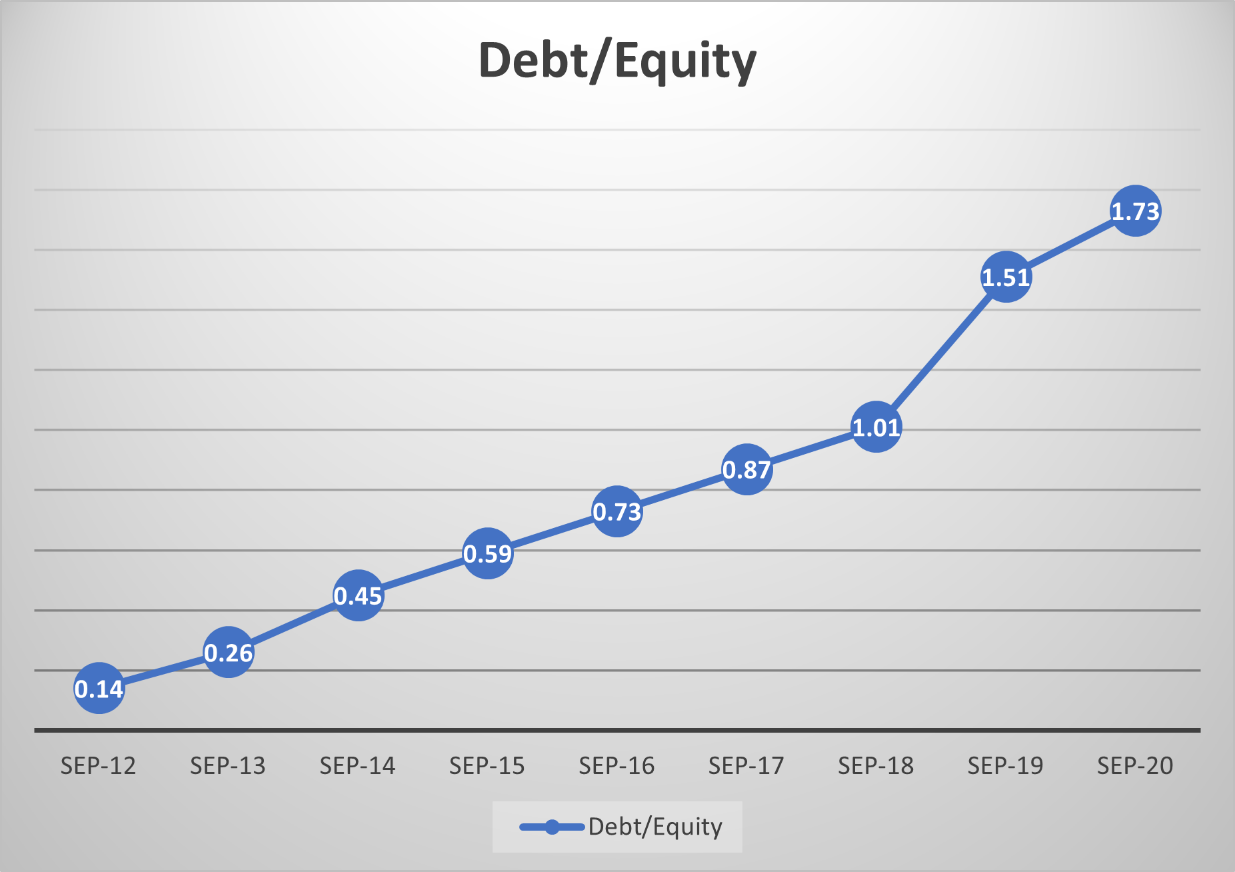
Apple's debt to equity ratio is 1.73, which is a bit high. The company will need to make principal payments at an average of $10 billion annually until 2026 and over $64 billion annually after that. The total term debt value is $118 billion.
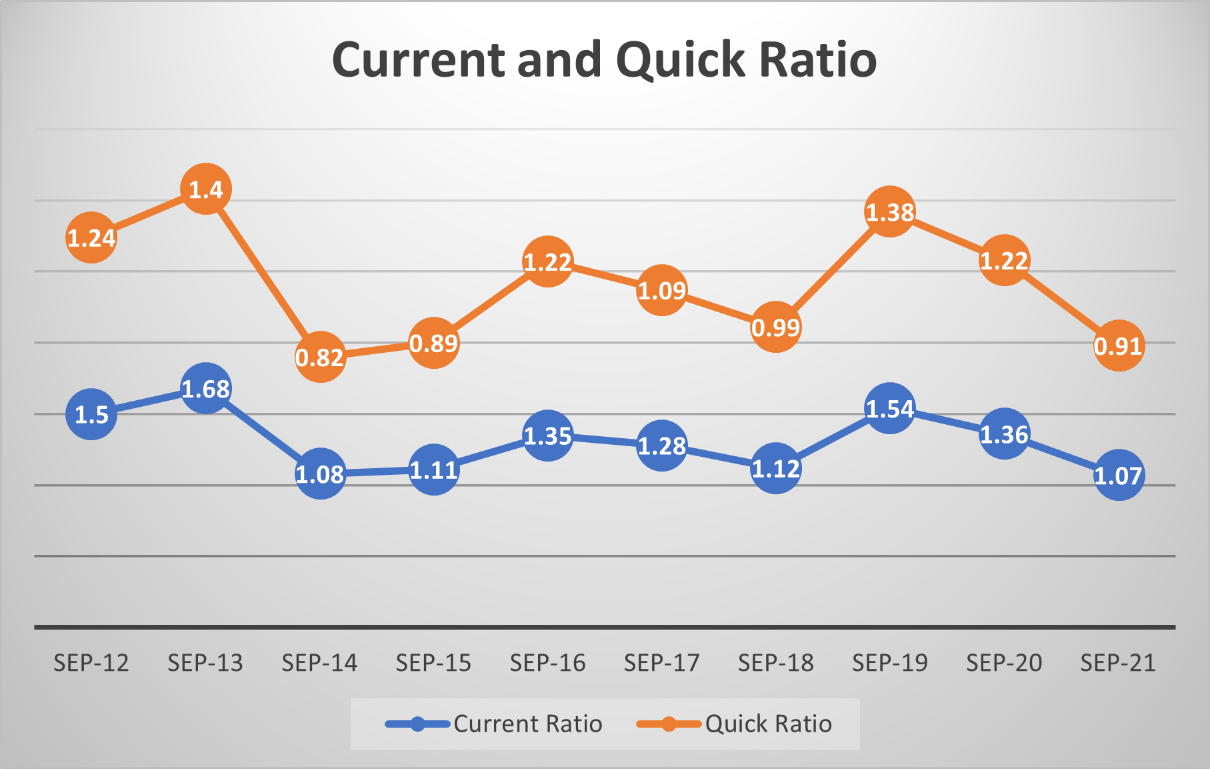
The current and quick ratios have been declining in the last two years, correlated with the increase in liabilities. The quick ratio is slightly concerning due to having a value below 1, and the current ratio is not healthy either.
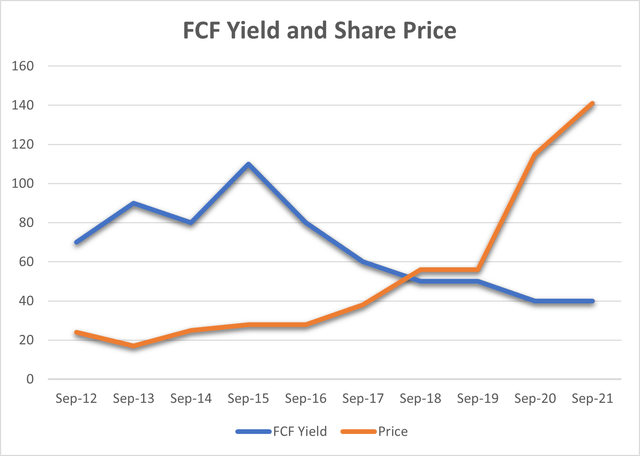
Free Cash Flow Yield
The chart below shows the relationship between the price and the FCF yield trend. This is another important metric in that it provides a measurement of the stock valuation. The stock price trending upwards while the yields are heading lower indicates an unsustainable trend and a likely correction in the short term.
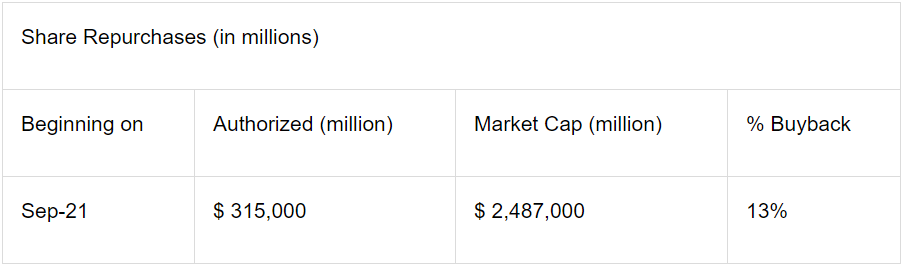
Share buybacks
Revenue Forecasting
To evaluate Apple shares' intrinsic value, we will need to estimate its future free cash flows, derived by subtracting the capital expenditures from the net cash provided by the operating activities. The latter is a Cash Flow statement item and is calculated starting with the net income and then adding and removing particular cash and non-cash items. In the case of Apple, the net cash from operating is usually about 25% higher than the net income due to the inclusion of the non-cash items that had been previously removed. CAPEX is forecasted by extrapolating the current trend into the future.
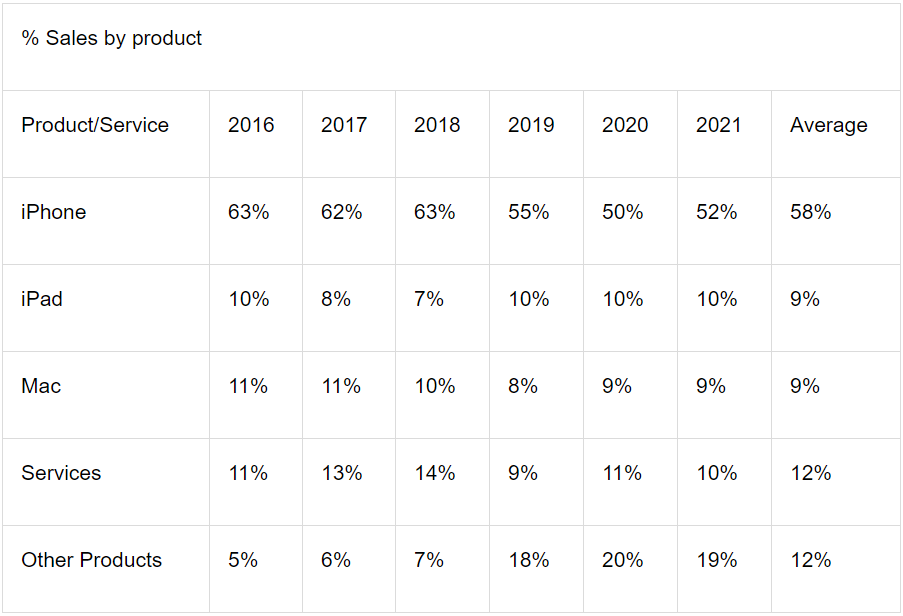
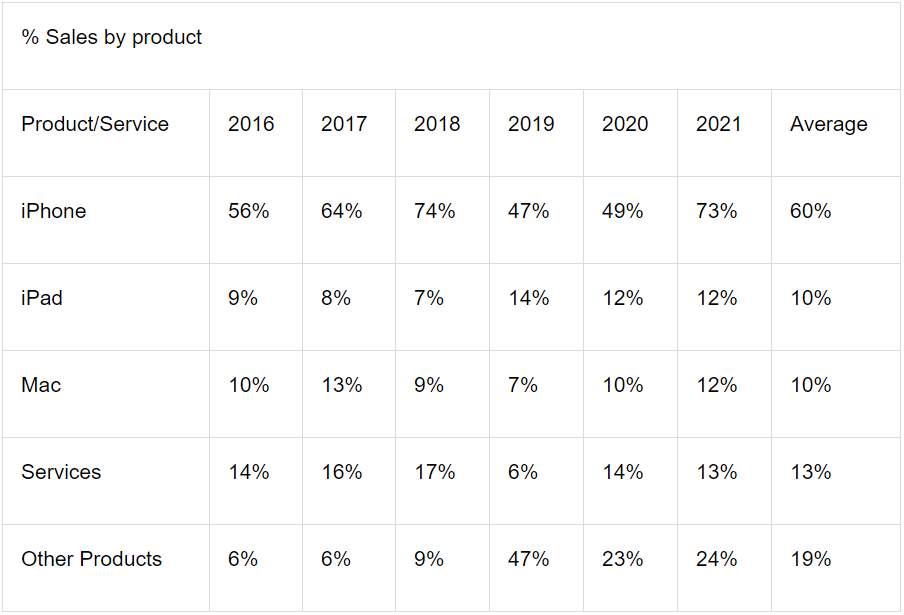
It is useful to know the percent share each Apple's products or services contribute to the total revenues when forecasting future revenues. This can be pulled directly from Apple's past annual returns, which I have done from 2016 to 2021. The percentages of each product revenue are in table 1 below.
Table 1
Sales trends for each product and service is as follows:
Table 2
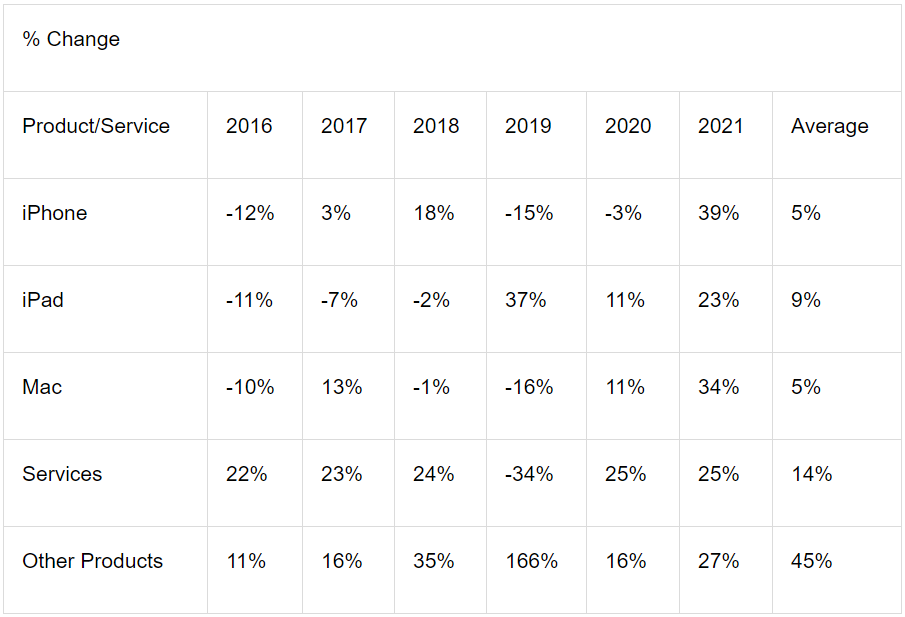
As seen in the above table, the linear average increase of iPhone sales from 2016-2021 has been around 5% annually, but until 2020, iPhone sales were slowing by roughly 2% annually. We also need to calculate the sales percentages for each product over the last five years based on the percent change from one year to the next. For that, we combine data from tables 1 and 2 to arrive at the table below, which shows each product's share of revenues based on the sales trends.
Table 3
Now that we have enough numbers to work with let's plug them in to forecast revenues for the next ten years. One thing worth noting is that the 2021 sales for each product have increased substantially once the pandemic restrictions began lifting, and such numbers are outliers and not sustainable during the next fiscal period. So we can expect a decrease in revenue growth in 2022, and I have calculated that decrease according to the sales trend before the pandemic.
To forecast the CAPEX, I have applied a 16% YoY increase based on past trends.
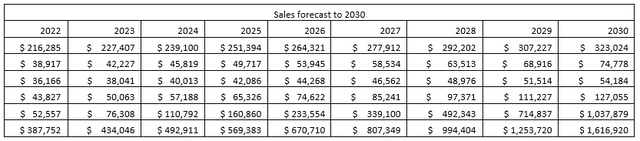
So now that we have all the required numbers, we can plug them into the formula to estimate the FCF up to 2030. Then, we can use the FCF values in the discounted cash flows formula to evaluate the current fair value of Apple stock.
Valuation – Discounted Cash Flows Model
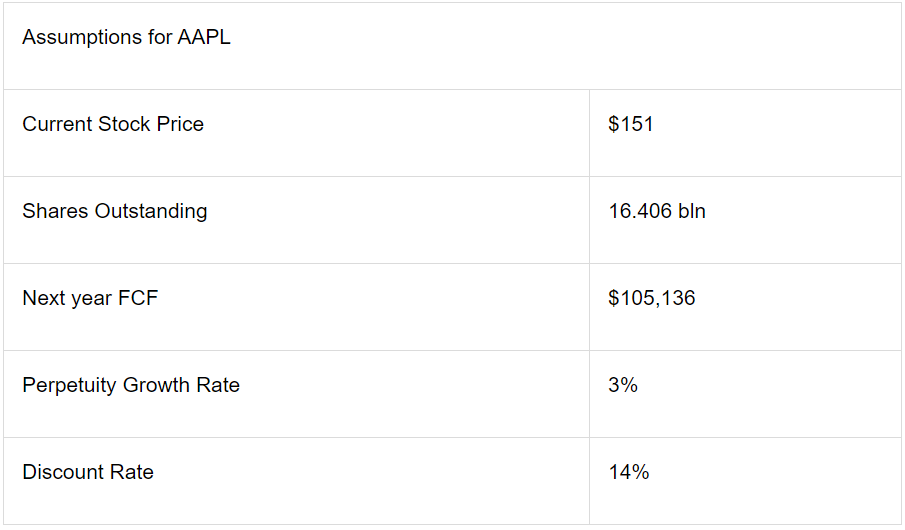
The discount rate is based on a 12% expected market return on our investment. S&P 500 long-term returns have averaged around 10%, whereas the returns have averaged 13.6% in the last decade.
Based on these calculations, the current fair market Apple share price is $313, which makes the shares around 52% undervalued. After applying a 33% margin of safety, the share price comes at $210 or 28% undervalued. Keep in mind that this evaluation uses a long-term horizon. I expect revenue growth to lag in the short term, making the shares slightly overvalued for the next 1–2 years.
In my opinion, this means that, in the short term, Apple shares will dip from the current levels or at least consolidate sideways, but I expect the share price to increase substantially from the current levels in the long term. This, of course, barring any general market correction or the appearance of a bear market. In that case, the revenues and future FCF will need to be revised downwards accordingly.
Technical Outlook
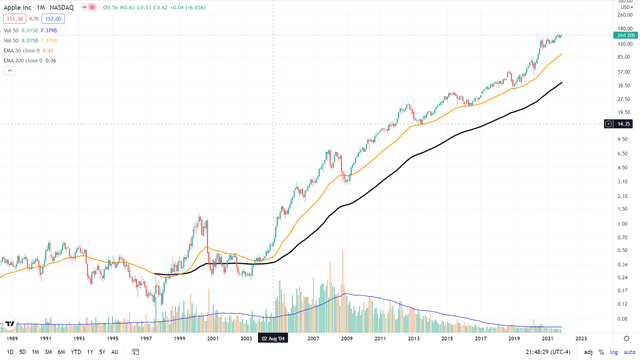
The trend is still up, but there has been quite a bit of volatility in 2021. Such chart pattern does not signal a reversal in the trend, but at the same time, it is difficult to see the price trending higher from the current levels. Most likely, there will be a consolidation in the next two years before we begin another climb.
Conclusion
I think Apple is a great company that will handsomely reward its shareholders in the long run, but it would probably be wise to apply a wait-and-see approach in the short term. Any dip in the range of $125-130 would be a good entry position. If, after a correction, it breaks above $160, that would be my signal to increase my position to take advantage of the next bull run. Until then, I will be on the sidelines waiting patiently.
精彩评论