
The ratio of the S&P 500 to the price of gold is nearing its 2018 peak. And if the ratio eclipses that level, it will be at a more-than 15-year high.
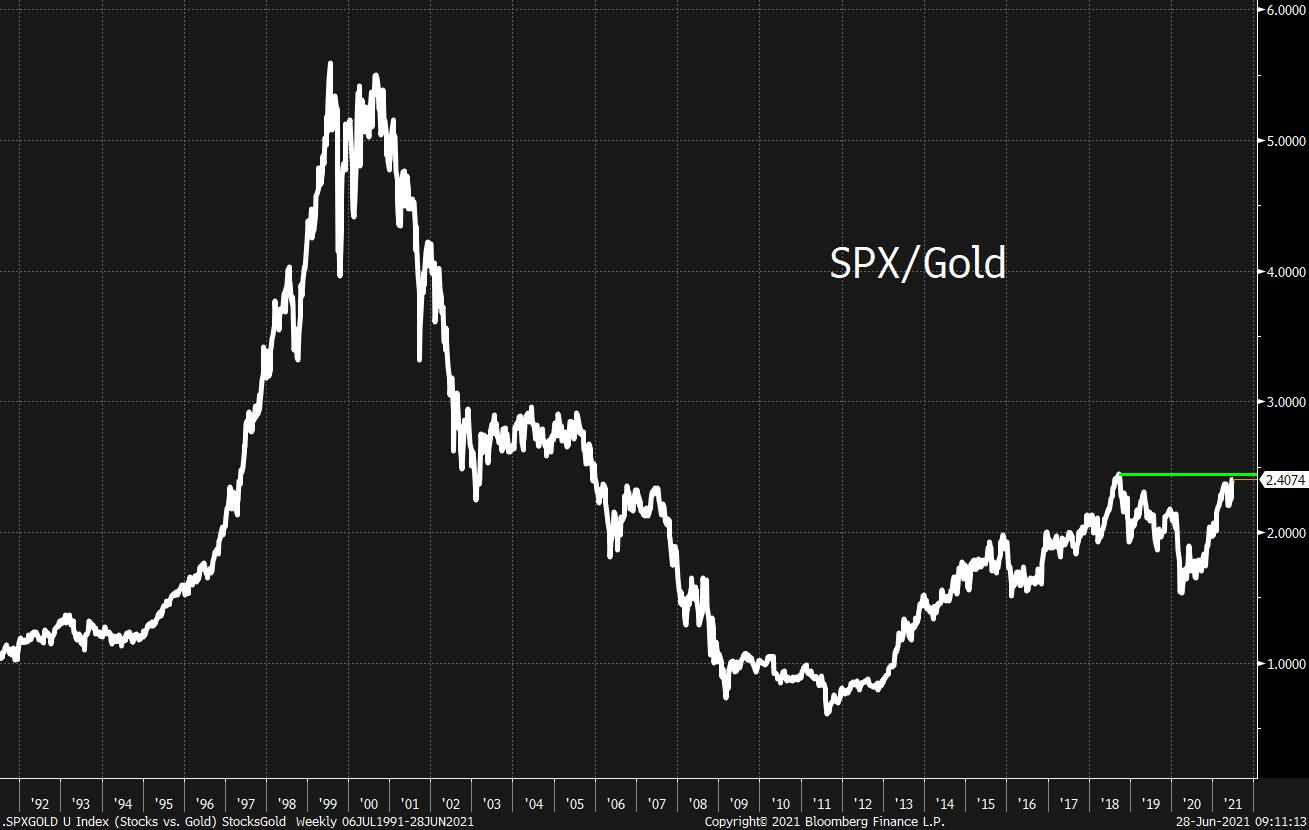
This simple chart tells a great story about fear and greed. Optimism and pessimism.
When people are feeling good, they bet on humans and companies. When people are fearful, they buy the yellow metal, which has been a store of value for thousands of years. It doesn’t do anything, really, other than exist.
Of course it peaked in the late `90s, when the world was bursting with optimism. It wasn’t just the dotcom boom that was happening, but that was also peak “end of history” times. Then the bubble burst. And not long thereafter, the attacks on Sept. 11, 2001, happened and led to years of war, causing the ratio to sink for a long time before going into freefall during the Great Financial Crisis. It only bottomed and started turning around in late 2011, which was when housing and other measures, like real wage growth, started to turn around.
The recent peak was in 2018, the last time emerging market stocks were soaring. That ultimately started giving way, however, after some higher-than-expected inflation readings and a series of Fed hikes throughout that year that caused the 2019 backtrack.
Obviously, the line plunged last year when the pandemic hit, and lately it’s been surging back. It’s well above its pre-crisis highs, and now as we see it’s on the verge of eclipsing 2018’s peak.