
Summary
- ARK Active ETFs are worth the management fee.
- Structured Lookback is introduced.
- Tails are shown to have a logical structure and consistent patterns.
- The concepts of Simultaneity and Sequentiality are introduced.
- CO/OC directional differences are important indicators that are much more useful than two-dimensional measures like standard deviation.

The Legend of Cathie Wood and Ark Active
Beatrix Kiddo: I am proficient in Tiger Crane style and more than proficient in the exquisite art of the samurai sword.
Kill Bill Vol 2 - The Cruel Tutelage of Pai Mei
There is no question that Cathie Wood will be elected to the Stock Picker Hall of Fame on the first year of eligibility. The last person achieving that honor was Peter Lynch.
Ark Active ETFs weren't really on my radar until after Trading Edge was published on June 1. At some point, I planned to make that article more about equity groups instead of ETFs, specifically biotech. Eventually the plan changed because that seemed premature.
Another reason for my lack of attention is that I usually look for issues with at least 1500 days of price history and the four horsemen of Ark Active passed that milestone less than 200 trade days ago.
Some commentators have mentioned recent negative return issues with ARKG, noting that the natives are getting restless. The first argument has some merit and touches on technical details that will affect the entire market. But, call me a romantic, I'm OK with cutting ARK a little slack here.
Tail Gunning
Tail is a statistical term related to data distribution. When data points are plotted, a bell shaped curve forms and the unusual results on either side of the curve are the tails. If the distribution is consistent with the ideal bell pattern, it is considered normal. Results of many coin flips produce anormal distribution, stock returns do not.
This implies that probabilities based on normal distributions are accurate while non-normal distribution probabilities are not. This is a serious problem for the academic discipline of Finance as not understanding probabilities suggests that it cannot offer a practical methodology to mitigate risk.
In this article, I will try to show that Ark Active returns are highly dependent on exploiting extreme tail activity. Hence the term tail gunning. Surprisingly, tail activity is more structured than one might initially think, so this may have some theoretical importance.
ARK Active has been quite good over many years at staying on the wild side.
The Legend of Data Manipulation
Modern stock exchanges and casinos both appeared in the first part of the 17th century, not long after the modern rules of chess were established. Academic disciplines relevant to understanding these innovations such as calculus, linear algebra, statistics, quantum mechanics etc. slowly developed over the next 400 years.
The revolutionary implications of data science have not yet been fully appreciated. Practical skill in data manipulation more than compensates for lack of formal academic knowledge in any of the other disciplines. A goal of my work is to demonstrate the soundness of this view.
A trained practitioner of statistical finance won't approach the stock return problem through data manipulation. No doubt, data manipulation is my hammer, so everything else looks like a nail.
Major weaknesses in the academic understanding of stuff in general include:
- Time
- High dimensionality
Volatility is a function of time, claims by some financial sages that they understand volatility are prima facie absurd. Academic deficiencies can be exploited by competent users of computer power.
In this article, I'll discuss how to set up and analyze market data, with attention given to the superb performance of the ARK Active ETFs.
Price History Data
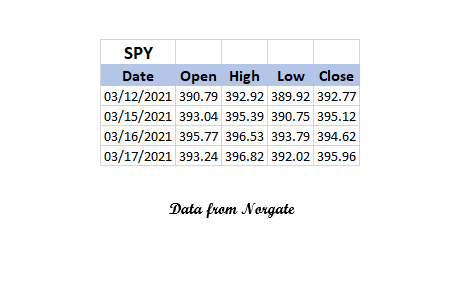
The analysis presented here, only considers the date, open and close. Financial statisticians generally consider daily open, high, and low numbers to be noise. Essentially, that is an admission of the limitations of their analytical framework.
Looking at one stock at a time is wrong on many different levels. It is absolutely critical to examine groups of stocks.
A mechanism is needed to produce historical daily prices for many different stocks. Prices must be adjusted for dividends and splits. The data should be stored in Excel csv workbooks where the workbook and worksheet names are the stock symbol.
Databases are inappropriate for historical price analysis. Rebuilding the data at least daily from scratch is quick and eliminates many possible points of failure.
It is best to solve the data problem by paying for a reliable delivery method like Norgate. Everyone who does this type of work, initially spends a lot of time figuring out how to get prices for free. I did that for about 15 years. It is good to build up the skill and understanding, but eventually the cost of inefficient use of time is substantial.
Data Transformation - Natural Log Returns
The per share price of a stock has absolutely no rational analytical relevance, assuming the investor has at least enough money to buy one share.
The human mind can deal with a limited number of things at once, and with stock groups, price is too much detail. Data transformation is a methodology to remove that complexity. Here, daily prices are transformed to a return stream. That makes it easy to analyze even large groups of equities.
Natural logs are the correct way to store a return stream, unless you are in a contest to find an inferior solution.
The simple calculations below need to be done for each date for each stock in the group being analyzed. It only takes a few minutes on an 8th generation i7 Windows PC to do this for hundreds of stocks containing thousands of days of price history.
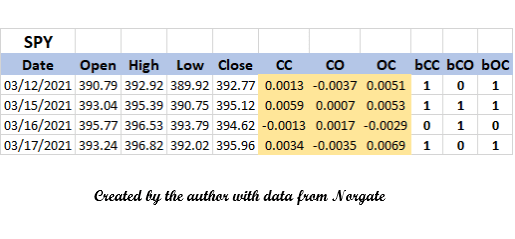
Using 3/16 in the table above as an example:
- CC(Close to Close) = natural log of 3/16 Close / 3/15 Close = nl(394.62/395.12) = -0.0013.
- CO(Close to Open) = natural log of 3/16 Open / 3/15 Close = nl(395.77/395.12) = 0.0017.
- OC(Open to Close) = natural log of 3/16 Close / 3/16 Open = nl(394.62/395.77) = -0.0029.
The bCC/bCO/bOC columns are binary answers to the question of whether the excursion was positive (1 = positive 0 = not positive). It is quite useful to answer questions before they are asked. This same technique is used to encode strategies into a return stream.
I specialize in low level stuff. For example, with the binary codes:
- If bCO = 1 and bOC = 1 Then bCC = 1
- If bCO = 0 and bOC = 0 Then bCC = 0
- otherwise, you have to check bCC.
Probably, most people wouldn't spend months analyzing the implications of that. I'm making good progress but still not finished. xSig, discussed below is related to that analysis. The issue is that if bCC = 4, bCO = 2, and bOC = 1 to create an Octal number; 3 and 4 can't happen.
1,400-Day Structured Lookback
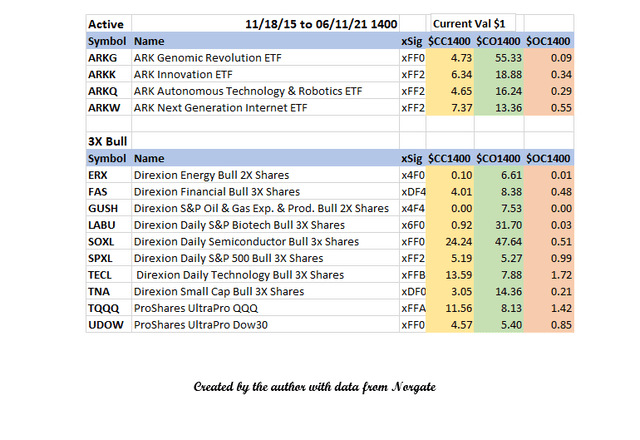
$CC1400 = $CO1400 * $OC1400
In my Trading Edge article, CC1400 was called tCC.
CO/OC Imbalance
The CO state is clearly dominant over OC. Trading Edge even suggested this may be a permanent market feature. It is somewhat heretical to even whisper of such things. If someone refutes that, I promise not to get mad.
Trading Edge considered the 3x Bulls to be the most obvious way to exploit the CO edge. ARK Active smokes the leveraged financially engineered abominations.
Structured Lookback Design
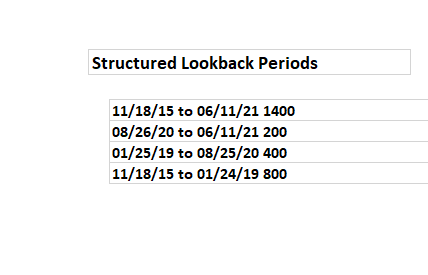
I introduced date yrmolation as a concept in my Kabbalah articlein January. Perhaps structured lookback is a better term, if only because it has more vowels. The idea is to provide a logical methodology for creating segments of sequential time.
The day is the standard market unit of time. The traditional day/week/month/year construct does not get us closer to a suitable lookback solution, and mostly just confuses the issue. Generally, one doesn't solve a problem by adding needless complexity.
Every total time frame of n days, is broken into 3 consecutive periods. The first period is 1/7 the total period, the second 2/7, and the third 4/7. I worked on this backwards of course, so:
- x[1] = 200
- x[2] = x[1] * 2 = 400
- x[3] = x[1] * 4 = 800
- x[0] = Total days = 200 + 400 + 800 = 1400
Another time concept is iteration. The study is labeled 200i0. i0 means iteration 0. An i1 study implies the 1400 days before 11/13/15.
xSig logic.There are three hex codes after the x. The bit values go:
- 8 = xx1400
- 4 = xx200
- 2 = xx400
- 1 = xx800
xFF2 appears most often in the table. This means:
- First/F - All structured CC periods have positive returns.
- Second/F - All Structured CO periods have positive returns.
- Third/2 - All OC periods except OC400 have losses.
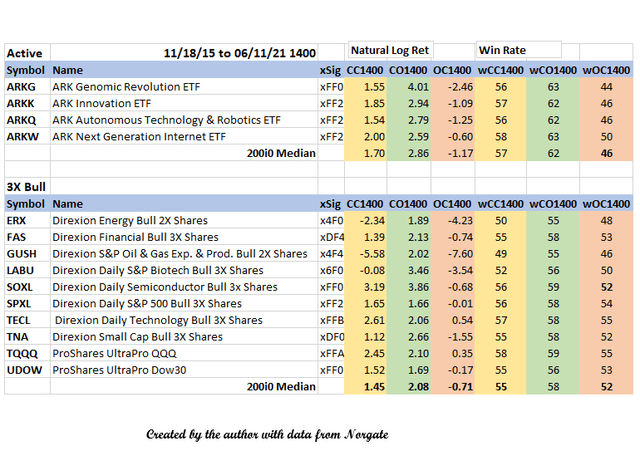
Win Rate
This is another critically important metric that virtually nobody looks at. In the table, the differences between CO and OC win rates are stunning.
400-Day Segment Detail
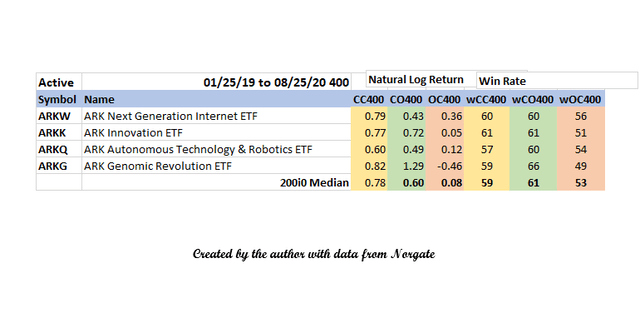
The 400-day segment showed the best numbers for OC so it is worth looking at. All four of the time segments display simultaneously on an HD monitor; the challenge writing about them is mostly how to cut up the information for the article format. The win percentages for OC are notably higher than those seen on the 1400 day study. ARKW performs respectably here, both CO and OC, but even in the best OC environment, with the most favorable ETF, CO is not worse.
ARKG
ARKG performs better CO than any of the 3x Bulls CC or CO. ARK win rates are all at least 62% CO, much better than the bulls. Win rates OC are much worse. Obviously, with the strategy of playing CO, ideally we want to see all positive returns during CO and all the negative returns during OC.
Performance Graphs
Sam: I never walk into a place I don't know how to walk out of.
Ronin
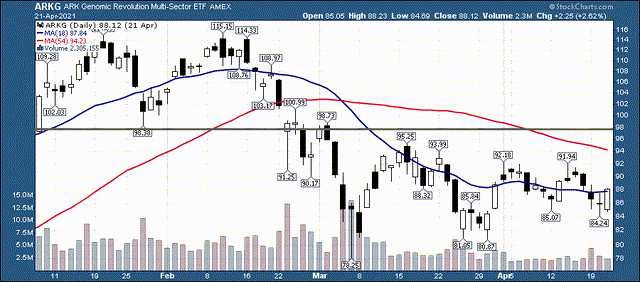
I can see how the recent sharp excursion down to about the 38.2 fib line might freak out some of the CC players, especially those who bought near the top. Personally, I'm afraid of parabolic heights, so it is difficult for me to visualize the thought process of the players who were buying at triple digits. Guess that is why I'll never be rich.
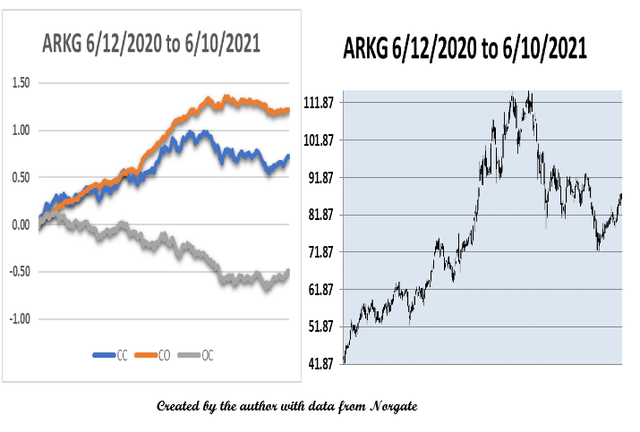
After detailed poring over the entrails and consulting entities whose names are best left unspoken, I think holding any of the ARK Active puppies CO is worth serious consideration.
I was really impressed by ARK's stock selection results and watched a recent interview of Cathie, where she was confident of the funds performing at the historical pace. Needless to say, I've been curious if she knows about the CO/OC imbalance where a CO player could theoretically beat buy and hold by about a factor of 10.
Finding Biotech Tail
Virtually all Biotechs are part of the tail when considered with the stock universe, so all one needs is a list of suitable candidates.
Biotech and Semiconductors are the two industries with the most favorable positive CO vs OC characteristics based on my research. Energy is also quite good, but I haven't looked at that sector closely. Small caps are also consistently favorable.
Biotech is a bit more persistent and obvious. An ETF performs at some sort of median to the characteristics of the group it is composed of, but ETF numbers pretty much precisely reflect the characteristics of the entire group.
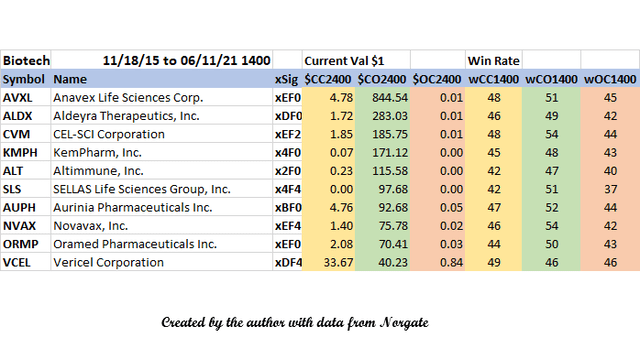
81 biotech stocks with average daily volume greater than 300K, and current price greater than $10 were assembled. The top stocks in CC, CO, and OC will be shown below:
Top Biotech CC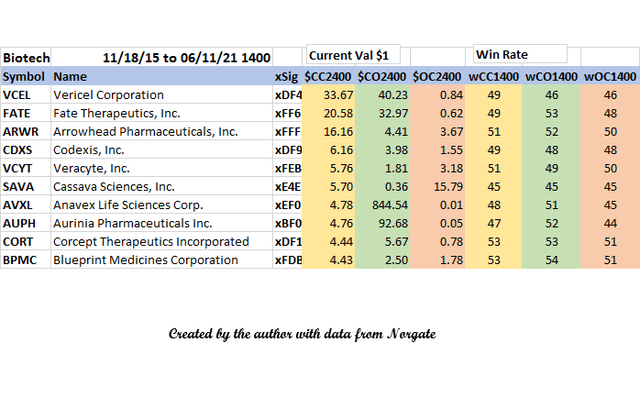
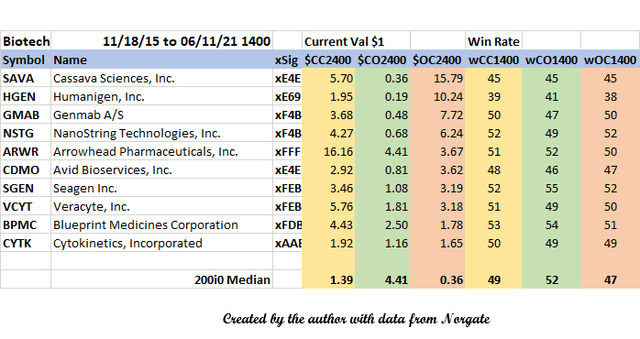
These are just overwhelming numbers arguing for CO. A random pick in this universe is much more likely to be profitable CO than anywhere else and that profit is much more likely to exceed CC. The win rates are lower than seen in most sectors. In general, this type of analysis is a fertile avenue for research.
CO/OC or Standard Deviation
The tendency of stocks to move in opposite directions CO and OC can be measured as has been shown here. These movements appear to be quite persistent and consistent in direction over time. The investor gains important and usable information by studying these structures, as opposed to standard deviation.
Standard deviation only measures CC and ignores violent movements during the day. A year is usually considered the proper standard deviation sample, mostly because any other length is equally worthless.
Recent Action
CO has not been a great performer lately. I've been noting that on my website since at least March I think. The more interesting thing is watching things unfold with a decent toolset and trying to figure out what is happening.
252-Day Structured Lookback
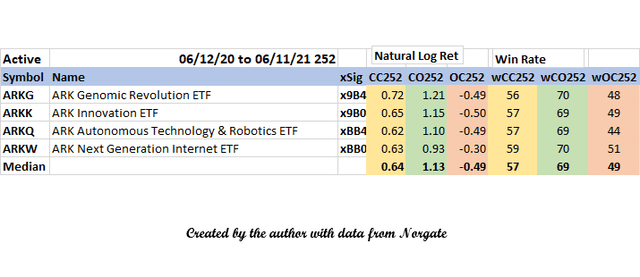
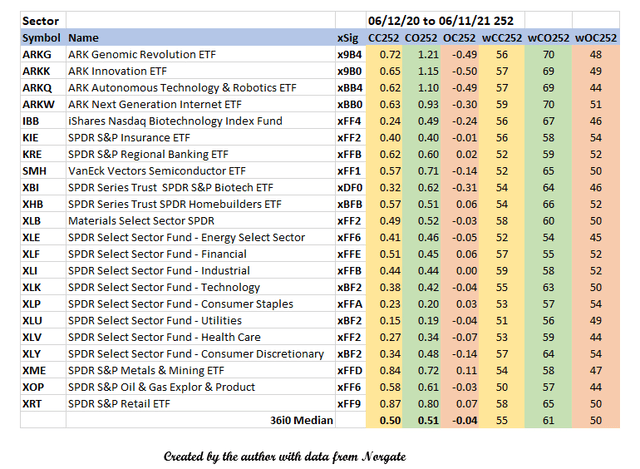
I'll stick with natural log results only in this pass. A natural log of 0.69 is doubling your money. 0.72 for ARKG is CV$1 2.06. All of the puppies at least tripled CO except for ARKW. Not bad for a year. Note the CO win rate.
xSig is weaker than long term as xFF is no longer showing. As time ranges get longer, xFF gets more common.
I guess the CC players got annoyed that things were better at this end point than 6/11/21. CO win rates are about the best I've ever seen.
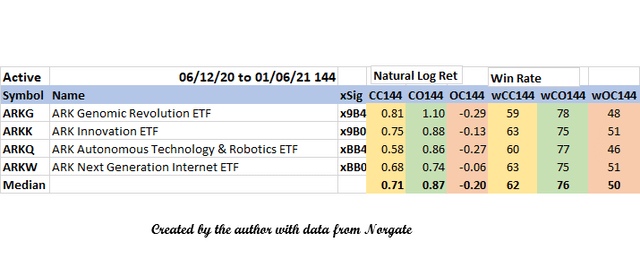
Win rates seriously dropped from the 144 day segment. The Biotech correction started February 9th.
The ARKG pattern starts with a double top. LABU and XBI made a single top, with a nice dark cloud cover candle that worked out for a change. In some parallel universes, they always work.
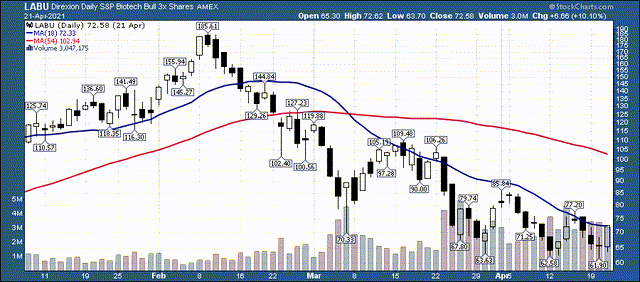
The black candles show the day traders getting slapped. No big deal for CO players. I'm happy I wasn't playing these guys during this period; no question I would have botched things up.
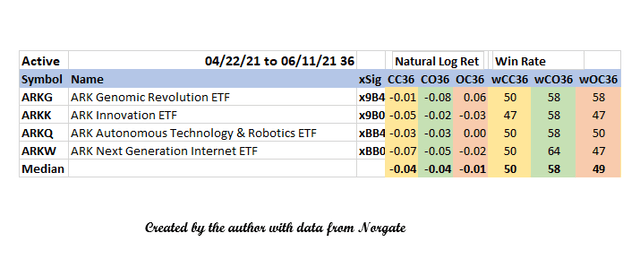
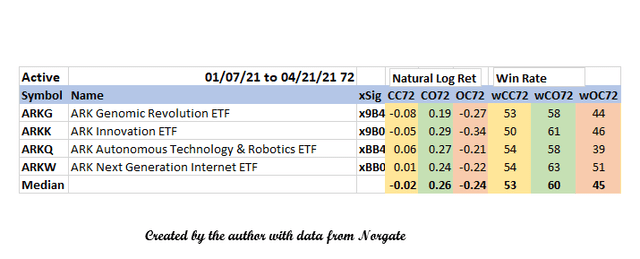
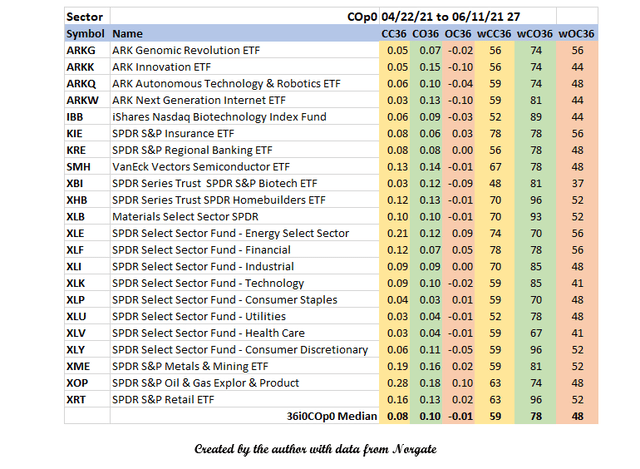
The 36-day shows weakness coming into CO and a little strength in OC at least for ARKG. Note the two winning percentages are the same. This is less trivial than it appears as that situation also exists in the Biotechs.
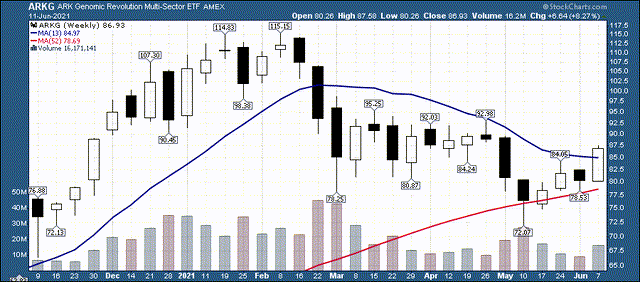
The recent low at 72.87 was not only the important ludicrously long term 38.2 fib line but the 52 week moving average, and on the other side of the chasm there is obvious support around 72. I don't see how that can be arranged to spell sell. Note the pop we are seeing off the low is coming on OC strength.
The plain meaning of the weekly chart is bullish: Heat sensitive longs from the congestion period, put stops in below the 52 week SMA that were triggered during the week of May 10. That is shown by the head fake and bottoming tail. Even a retest of the low would probably not be too bad, but hopefully that won't part of the near term conversation. The poke above the 13-week SMA is encouraging, a move above 93 doesn't seem excessively optimistic.
Is The 252-Day Structured Lookback Kosher?
252 market days is as close to an exact calendar year as you can get. 252 / 7 = 36. Therefore we can say that a market year is divided into 7 periods of 36 days. In this scheme, every day is the end of a year.
WithGematria, the number 36 is 2 * 18. 18 = Life. 36 is comprised of the letters Lamed Vav, which correspond to theTzadikimNistarim, the 36 hidden righteous ones who support the world in every generation.
Somehow, that gives me a little confidence that the structured lookback solution isn't completely ridiculous. It is definitely kosher.
Simultaneity and Sequentiality
Adm Mark Turso USN Ret: You were given a Ferrari and your people treated it like a lawnmower.
The Bourne Legacy
Earlier, I mentioned the binary codes bCC, bCO, and bOC. These probably have to be understood to understand the CO/OC imbalance. They are useful in understanding the forces of simultaneity and sequentiality which propel stock prices.
The ARK Ferraris are included with the lawn mowers.
XBI and IBB are weird with their different returns, which is not easily exploitable.
Buy The Dip Or Pop - CCn1 or CCp1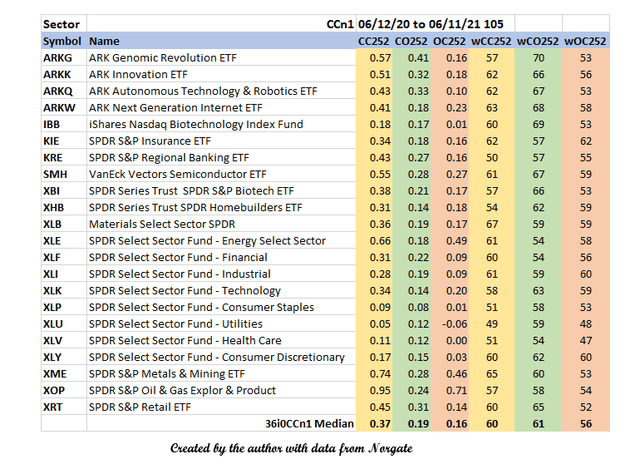
CCn1 means CC negative returns of the Specter stock from the previous day are analyzed. The Specter stock is SPY. The specter functions something like a clock and provides high dimensional order to the group.
This happened 105 times in the last 252 days - note end of top line. The bulk of CC profits occurred after this happened. The CC median win rate is 60 instead of 55. Note that this state accounts for more than 100% of OC profits.
CCp1
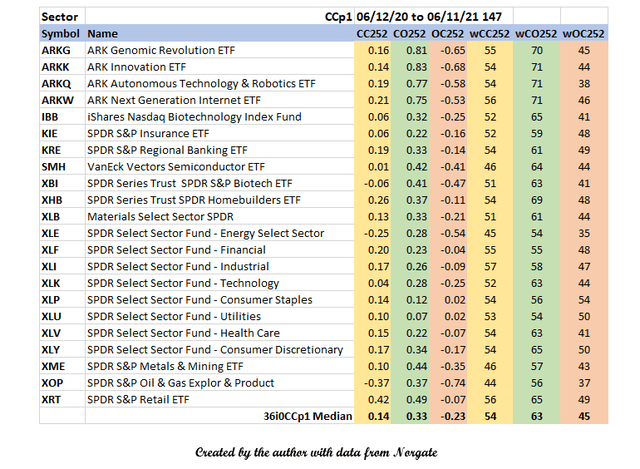
These might be good examples of sequentiality, or not.
SPY is Positive or Negative CO Today - COp0 or COn0
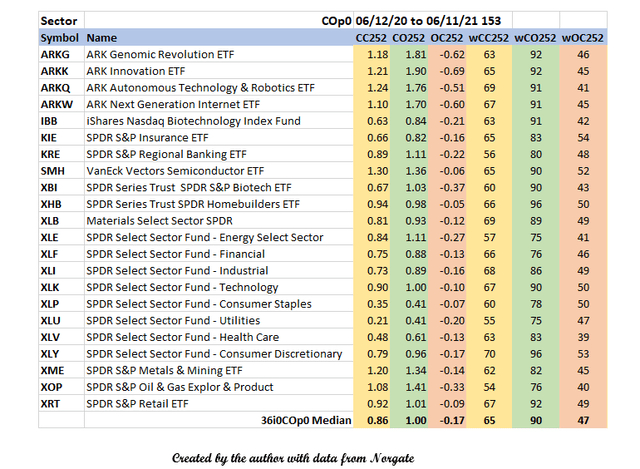
This is an example of simultaneity. If SPY is up OC 90% of the sector ETFs will go up.
Simultaneity has weakened during the last segment and probably a little before that as well.
COn0
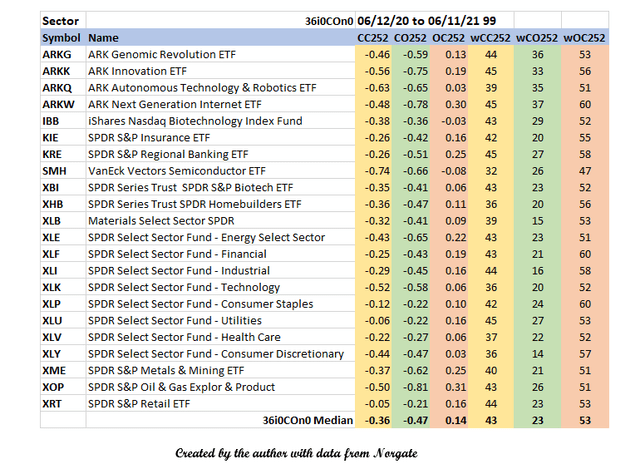
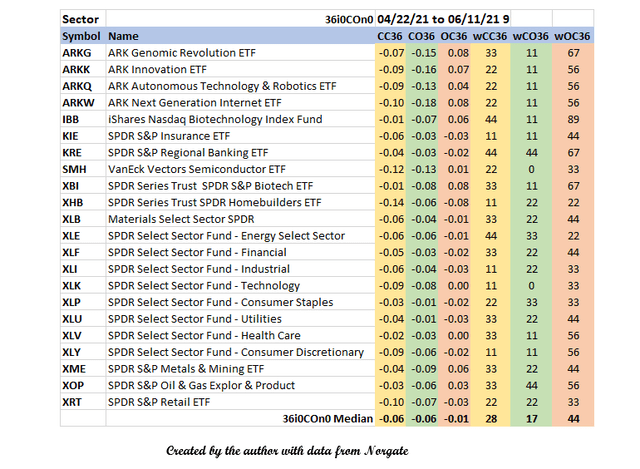
The 36-day view shows the sectors having consensus on SPY down moves rather than up moves lately. There has been no lack of buyers OC.
Essentially, this type of analysis adds a concrete framework that shows a pretty subtle picture of market state. It confirms a vague feeling many have noticed that things are changing.
I doubt that mechanical CO playing is ready for prime time just yet. Certainly the CC/CO binary results above need to be better understood. Mostly, I think the analytical framework presented here is quite powerful and worth continued development.