
Summary
- Microsoft continues to grow. Moreover, it is accelerating.
- By and large, the company's most recent quarterly report was reflected in the company's price in advance.
- Technically, the company's share price has hit the ceiling now. This means that a sideways trend is quite likely in the near future, despite the excellent quarterly results.
Intro
This article provides a comprehensive look at Microsoft's (MSFT)
#1 First impression of quarterly results
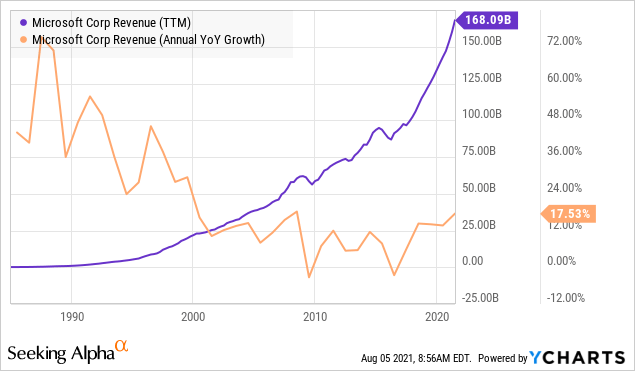
Microsoft's quarterly net income rose by 47% YoY and revenue by 21.35%, beating analysts' expectations for the tenth straight quarter. But the most surprising thing is that the company has grown in almost all directions.
LinkedIn revenue grew 46% due to 97% growth in LinkedIn Marketing Solutions. Revenue from server products and cloud services increased by 34% due to the growth of Azure by 51%. Revenue from sales of Dynamics products increased by 33%, Intelligent Cloud by 30% and by 25% Productivity and Business Processes. Revenue from commercial products Office and Windows increased by 20%:
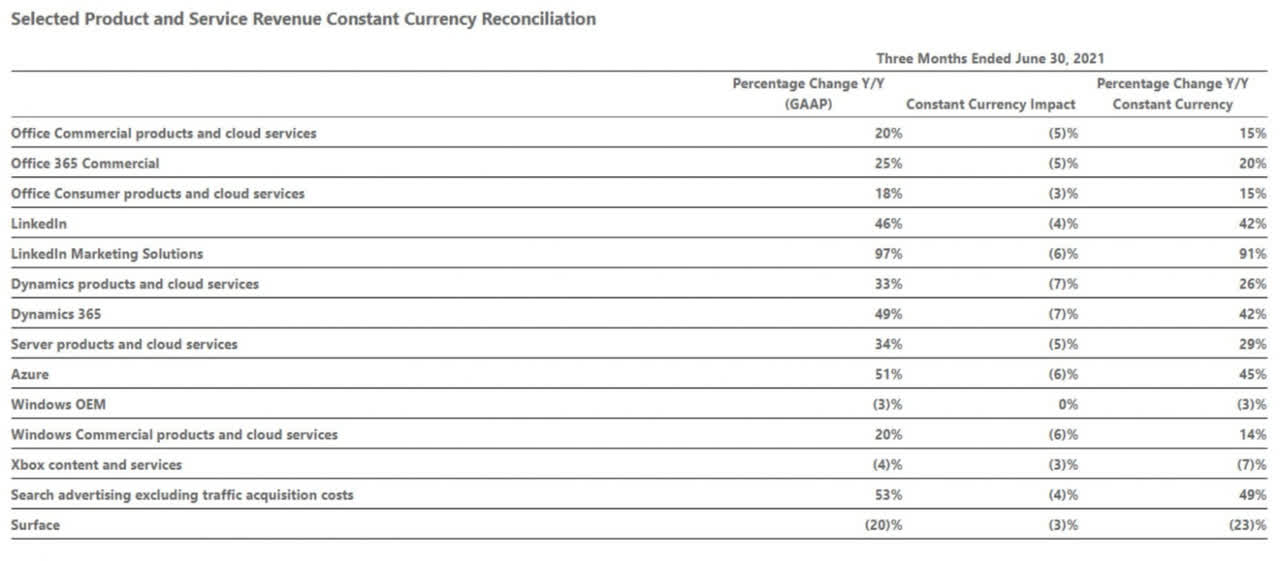
Revenue from devices of the Surface family fell by 20%. But this is probably due to a general deficiency of components.
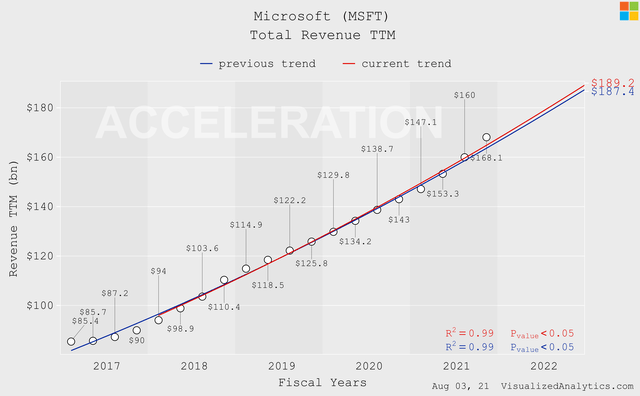
All this led to the fact that the company's revenue turned out to be higher than its long-term trend, which is a sign ofaccelerating growth:
#2 Price vs. Growth
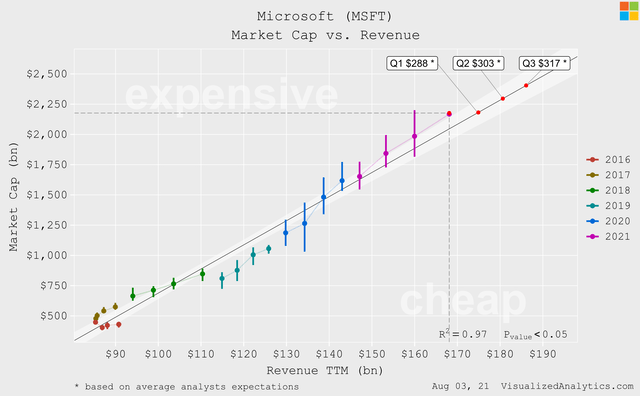
Considering Microsoft's capitalization as a function in which revenue is the independent variable, we get a model that indicates a slightly overvalued company present price:
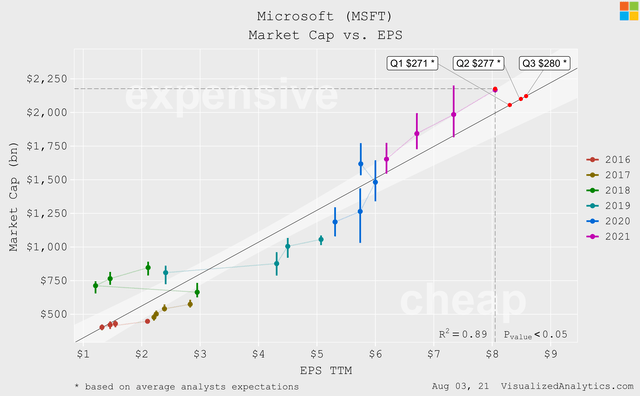
We get the same result by considering EPS as the independent variable:
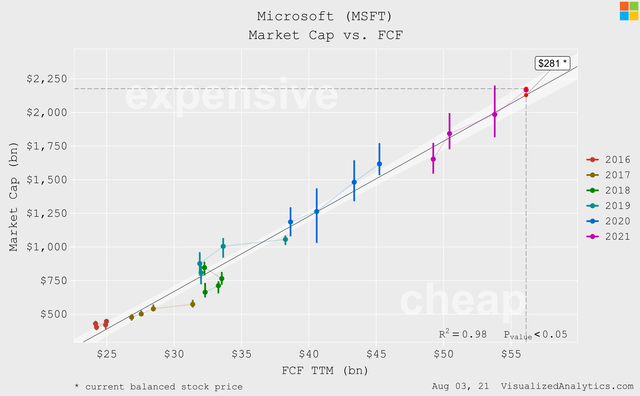
However, the most qualitative model (R^2=0.98) in this case is built on the basis of Free Cash Flow. And this model indicates an almost perfect balanced state of the company's capitalization:
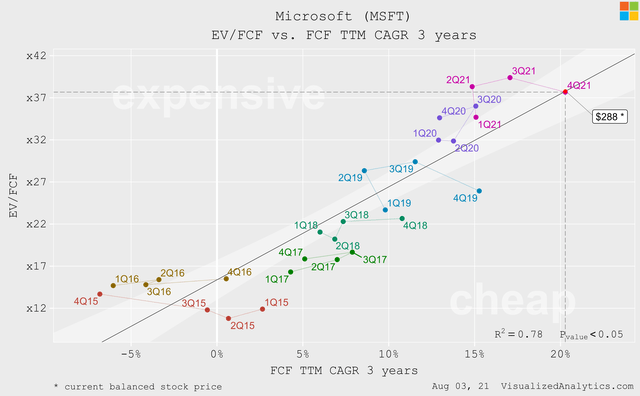
Interestingly enough, the EV/FCF multiple has responded well to Microsoft's Free Cash Flow growth rate over the past six years. And, as the following graph shows, the current growth rate of this indicatorperfectly justifies Microsoft's capitalization:
I understand that this is a very simplified view of the company's valuation, but in this context, Microsoft's capitalization is now balanced. In other words, the market has already reflected the company's quarterly results in price.Digging deeper...
#3 Comparative Valuation
In the context of the comparative analysis, I only trust forward multiples and, ideally, adjusted for the expected growth rate. This is because the market is always focused on the future and companies are best compared at the same point in their life cycle. One of the solutions to this problem is the use of forward multiples, which are adjusted for the expected growth rate of the basic indicator.
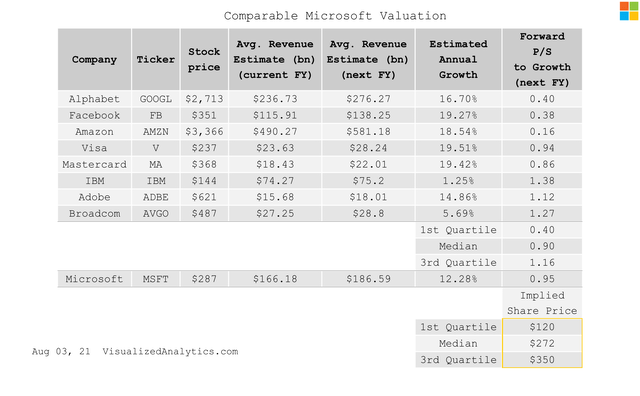
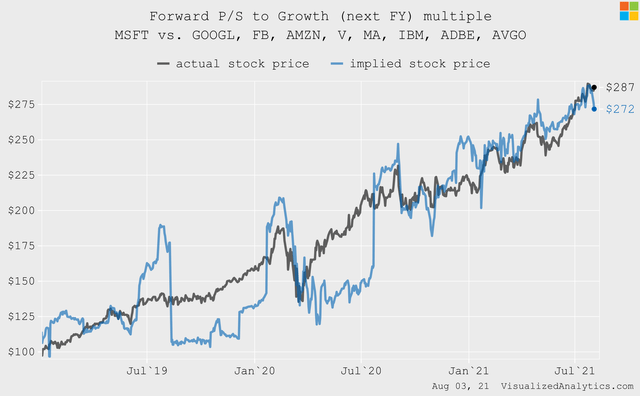
So, this is what we get analyzing the forward P/S to growth (next FY) multiple:
And this is what we get analyzing the forward P/E (next FY) multiple:
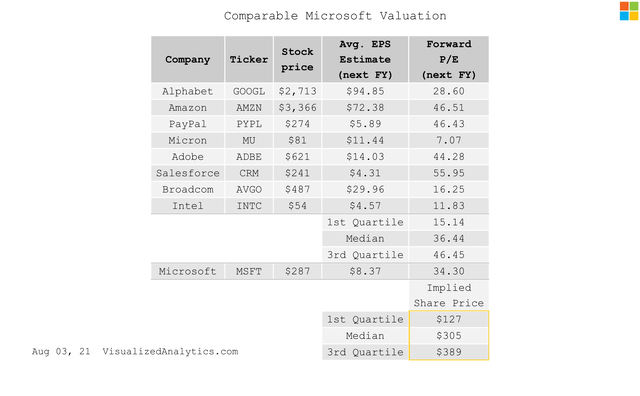
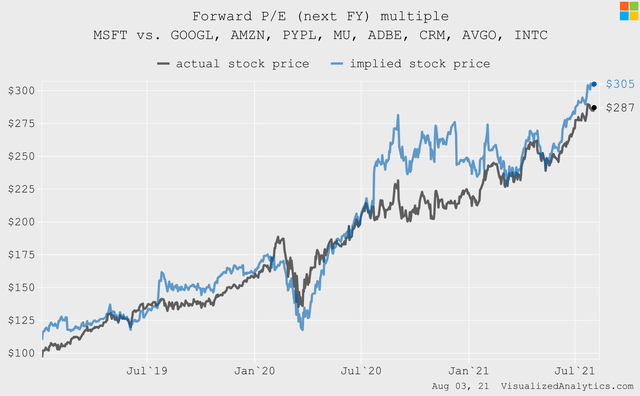
In both cases, comparing Microsoft to a broad sample of American technology companies, we get a result close to the company's current share price. Again, we draw a conclusion about the balanced state of the current price.
#4 Discounted Cash Flow Model
When predicting Microsoft's revenue for the next decade, I proceeded from the average expectations of analysts. But, even in the historical context, I consider it adequate to expect that the average annual growth rate of the company's revenue in the next 10 years will be about 12%.
The operating margin of MSFT is relatively very high now:
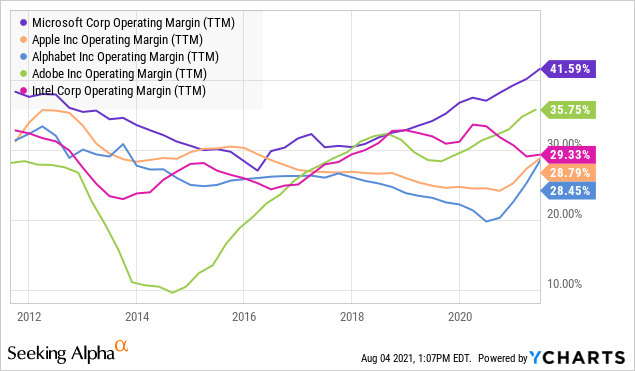
But I find it wrong to assume that Microsoft's operating margins will continue to grow in the future. First, because the dynamics of this indicator is cyclical in nature. Secondly, where there is a high margin, competition inevitably grows. Therefore, the model includes a forecast of a gradual decrease in the operating margin to a more adequate 33%.
Here is the calculation of the Weighted Average Cost of Capital:
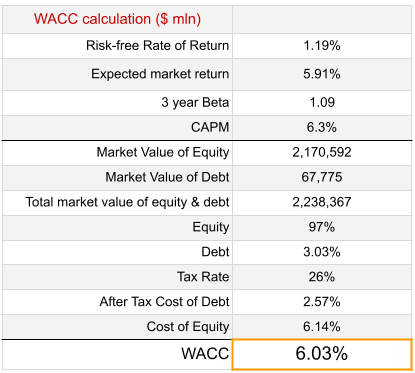
Some notes on the WACC calculation:
- In order to calculate the market rate of return, I used values of equity risk
- I used the current value
- To calculate the Cost of Debt, I used the interest expense for 2020 and 2021 divided by the debt value for the same years.
Other important parameters of the model are as follows:
- The relative size of CAPEX is assumed to be 10.7%, which is close to the long-term average.
- The tax rate is assumed to be 26%, which is close to the world average.
Finally, here is the model itself:
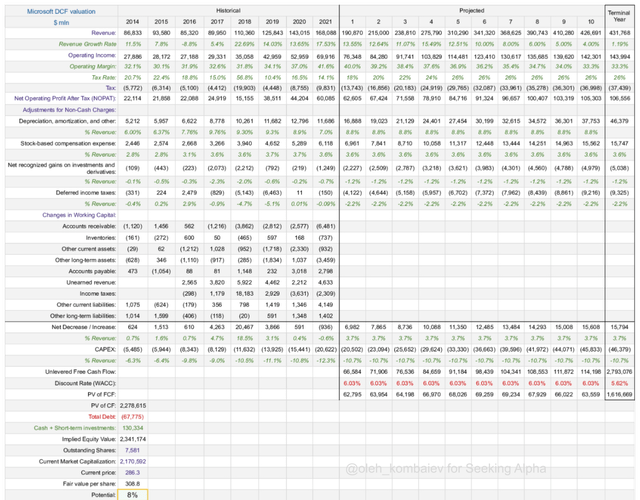
The model shows Microsoft is undervalued by 8%. In fact, we once again state the balanced level of the company's capitalization.
#5 Dividend Discount Model
As a basis for Microsoft's Dividend Discount Model, I took the average expectations of analysts regarding the company's EPS in the next decade. But this is not enough to predict the net income, because it is still necessary to predict the number of shares.
The number of Microsoft's diluted shares has been declining since 2012. Although the rate of decline has slowed down over the past two years:
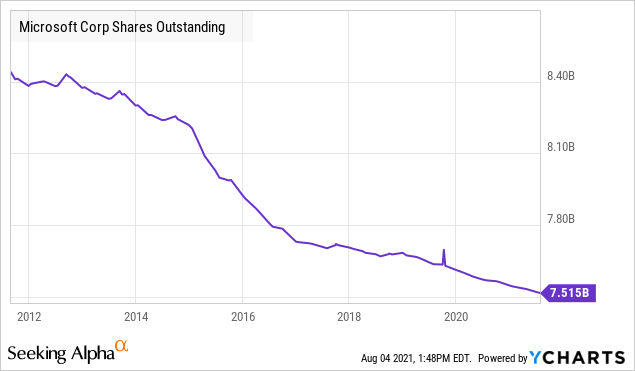
I proceed from the assumption that the dynamics of the last two years will continue, and by the terminal year, the number of diluted shares will be reduced to 7.2 billion.
Among the other parameters, I want to highlight the following:
- In the model, I assume that the payout ratio will remain at the average level of the last three years (35%).
- In the terminal year, I assume an increase in dividends of 3.5% (GDP growth of 2% and inflation of 1.5%).
Here is the model:
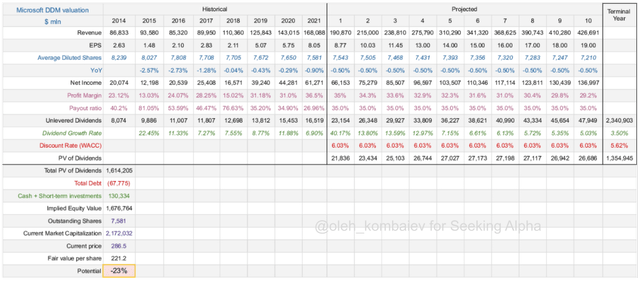
The DDM-based target price is 23% less than current levels. But, as long as the company has the potential for free cash flow growth, I think dividends are not the key motivation for investors. Therefore, in this case, this is a very strong result. For example, in the case of Apple (AAPL), things are much worse.
#6 Technical picture
Microsoft stock has been following an exponential trend over the past decade:
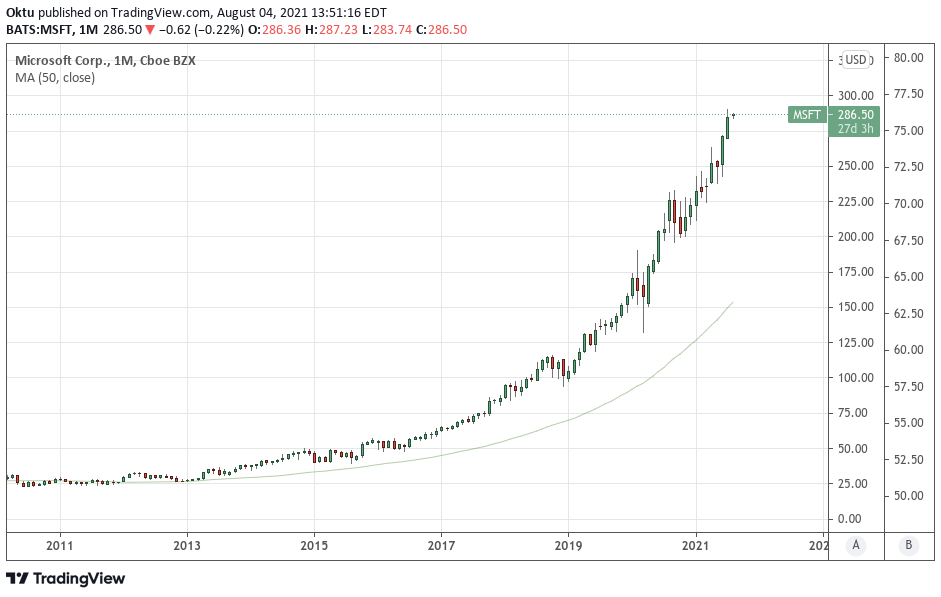
In this case, in order to highlight the usual linear channels, one should consider the graph with the logarithmic Y-axis:
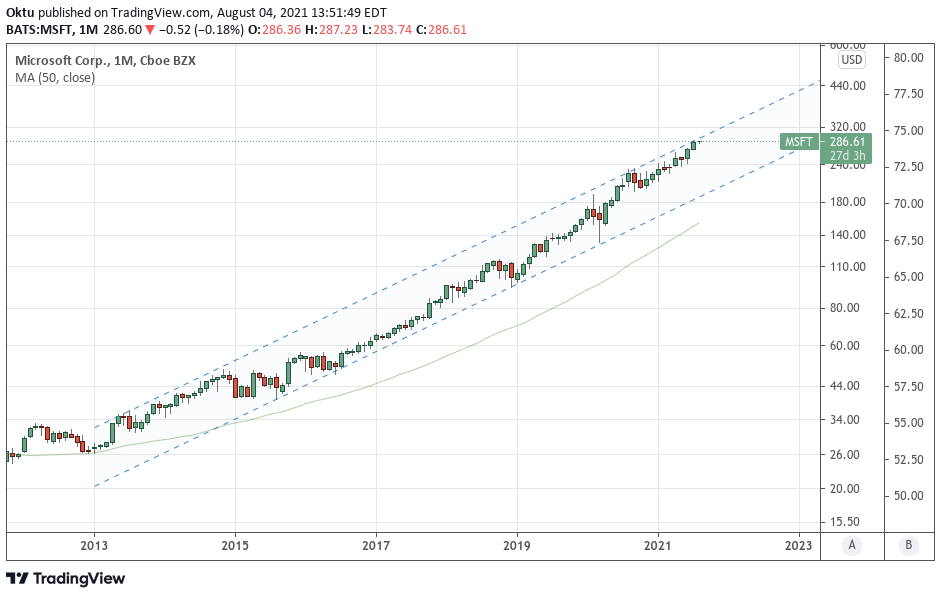
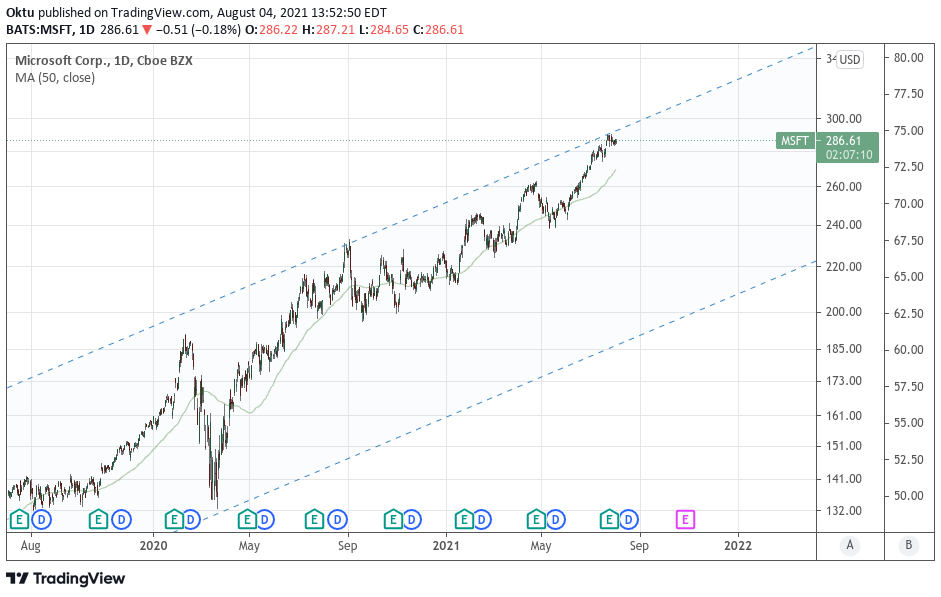
In this case, we are clearly fixing the movement in the ascending channel. Moreover, the price is now at the upper border of this channel. In fact, this means a strong zone of resistance.In such cases, it is appropriate to expect a sideways trend or even a correction:
Bottom line
So, I tried to look as versatile as possible at Microsoft in the light of the latest quarterly report and summarize the following:
- The company continues to grow. Moreover, it is accelerating. In my opinion, this is the main condition for expecting capitalization growth.
- Fundamentally, the company is not undervalued. This means that, by and large, the company's most recent quarterly report was reflected in the company's price in advance.
- Technically, the company's share price has hit the ceiling now. This means that we need to calmly accept the fact that a sideways trend is quite likely in the near future, despite the excellent quarterly results. At the same time, the long-term upward trend remains relevant.
- I would also like to note the fact that given the current cost of capital, the present value of all potential Microsoft dividends assumes a fair price of the company at $220. And this is anexcellent result, considering that the company continues to grow in quantitative terms. This is a kind of bonus that a long-term investor will receive in addition to the likely increase in the share price.