
S&P 500 bulls keep failing to take control.
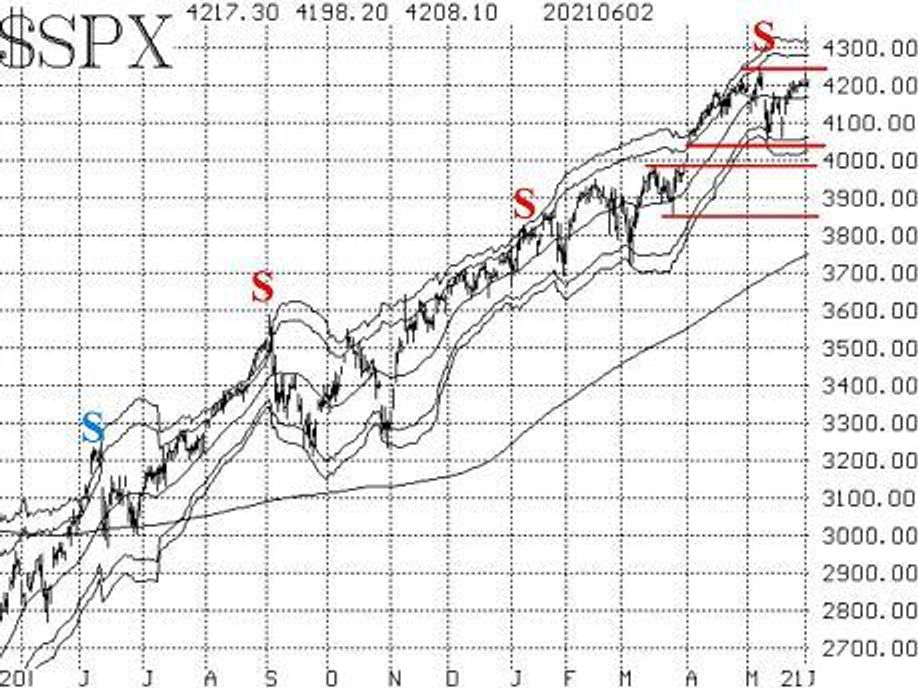
The S&P 500 indexSPX,+0.88%probed up to – but not beyond – its all-time highs at 4238. The failure to break through to new highs this week gives the bears another chance.
The broader picture is that the index has been trading in a range between 4060 and 4238 for nearly two months. Given the length of time the S&P has spent inside this range, a breakout from the range should be significant.
An aggressive way to deal with a trading range is to buy the market near the lows of the range and sell (short) the market near the top of the ranking, planning to reverse your position if the market does indeed break out of the range. A less aggressive trade is to buy straddles when SPX is near the top or bottom of the range, figuring that it will either break out or trade to the other side of the range.
The S&P has been sitting near the top of the range since May 24. The longer it goes without breaking out to new all-time highs, the more likely it will trade down to the lower regions of the range.
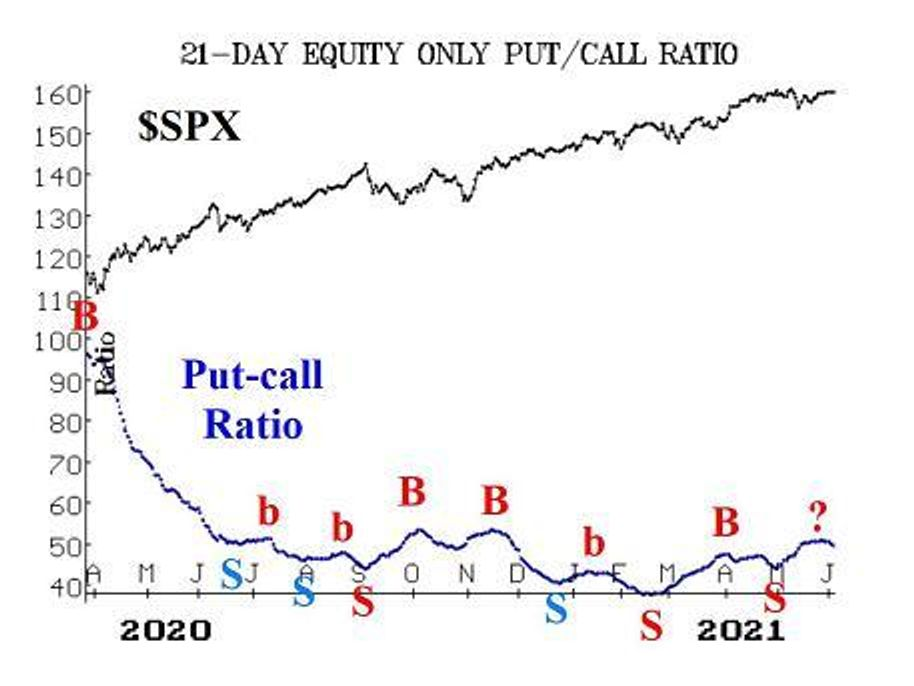
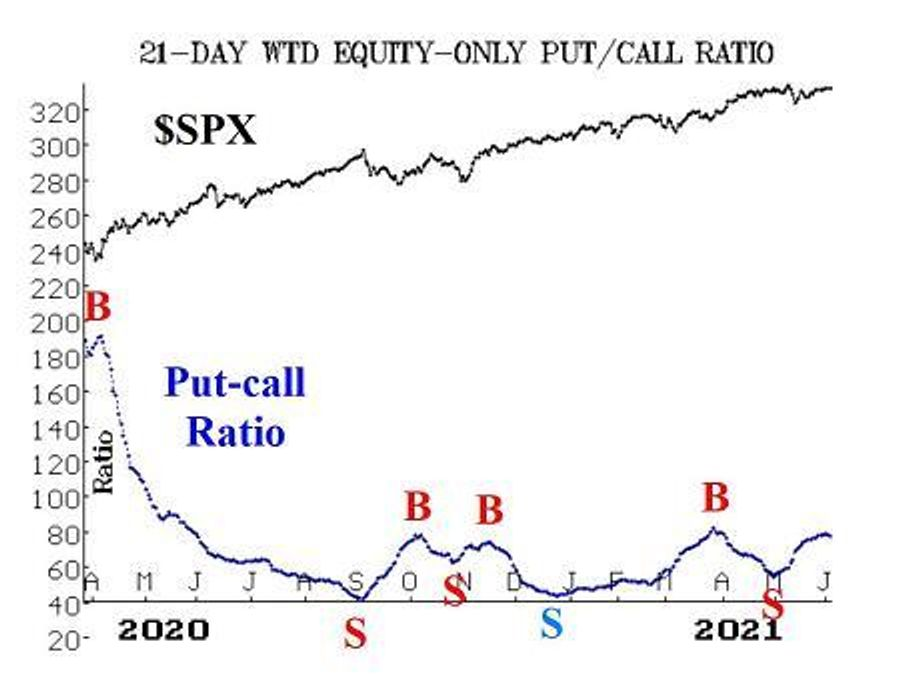
Equity-only put-call ratios are still on sell signals, at least according to the computer programs we use to analyze these charts. However, to the naked eye they are no longer rising (which places the sell signals in jeopardy). One can see that the standard ratio has taken a dip over the past couple of days (the dip being caused, in part, by extremely heavy call buying in the “short squeeze” stocks: AMC, BlackBerry, Beyond Meat etc.).
New 52-week highs continue to easily outnumber new 52-week lows on the NYSE and elsewhere. Thus this indicator remains bullish. In fact, the number of new highs has expanded considerably and is near the extreme levels last seen in late February, but not seen for five years prior to that.
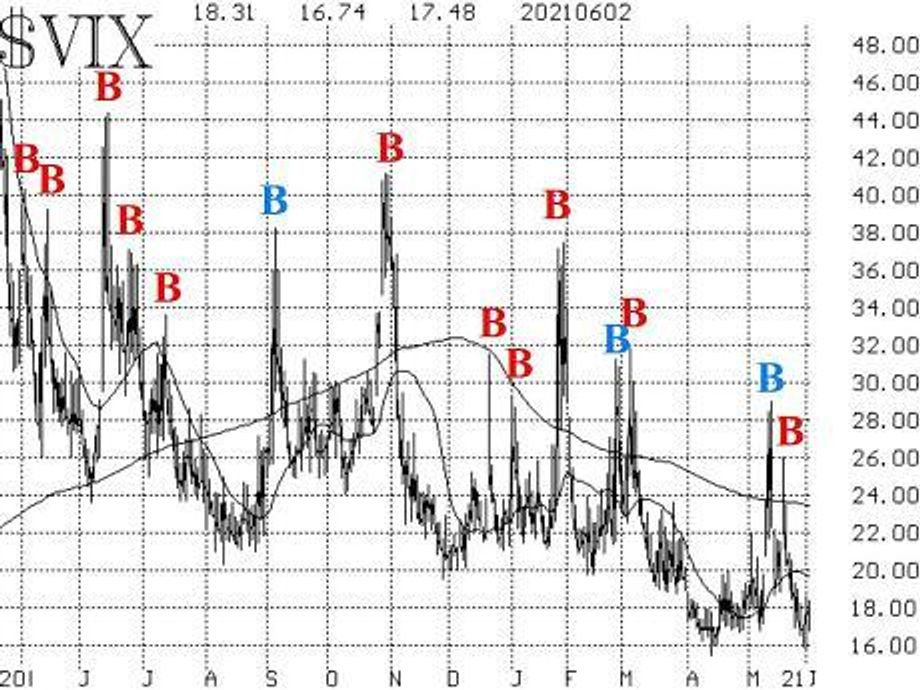
The volatility “complex” is bullish on stocks, in general. The VIX “spike peak” buy signal remains in effect, and the trend of VIXVIX,4.63%is downward. Traders are still reluctant to push VIX down to extremely low levels, but one can see from the accompanying chart that VIX is below both its 20-day and 200-day moving averages. As long as the trend of volatility is lower, that is bullish for stocks.
In summary, there are mostly bullish indicators in place. However, the most important indicator – the price of the stock market itself – is not confirming this apparent bullishness. It needs to break out to new all-time highs to do so, and that has been lacking.
We continue to expect a volatile move away from current levels – whether that entails a retracement to the lower end of the trading or a strong breakout to new all-time highs. Hence, we are employing trading range strategies, along with holding positions in line with confirmed signals from our indicators.
New recommendation: Cornerstone OnDemand
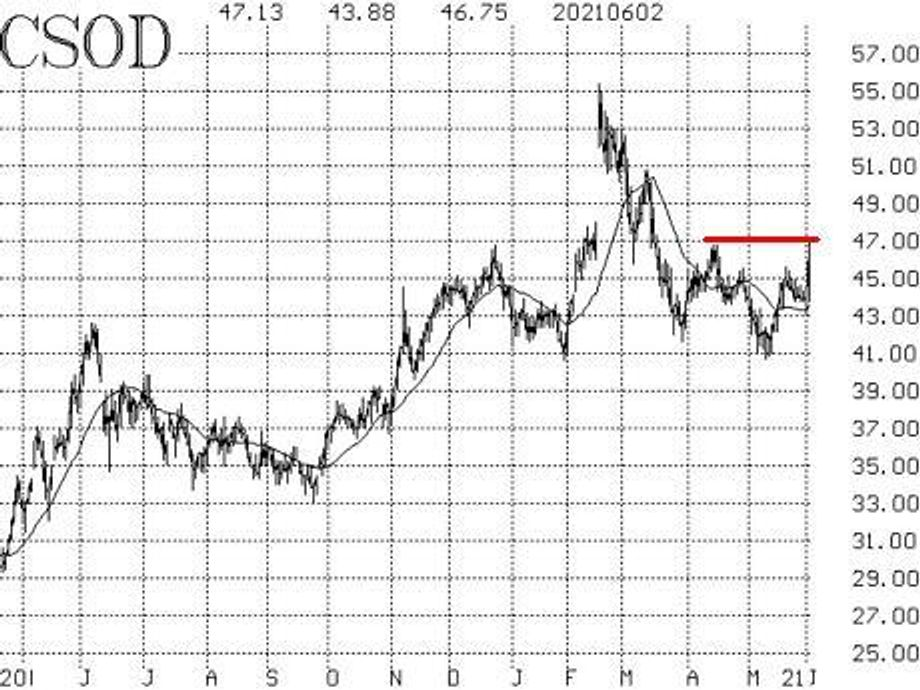
Option activity has increased dramatically in Cornerstone OnDemandCSOD,+3.39%as there are takeover rumors. The stock traded up to near-term resistance at 47 and then fell back. We are going to use a contingent recommendation here. In other words, we will only buy the CSOD call options if the contingency is fulfilled:
IF CSOD closes above 47, THEN buy 4 CSOD July (16th) 47.5 calls
If the calls are bought, we will hold without a stop, while the rumors play out.
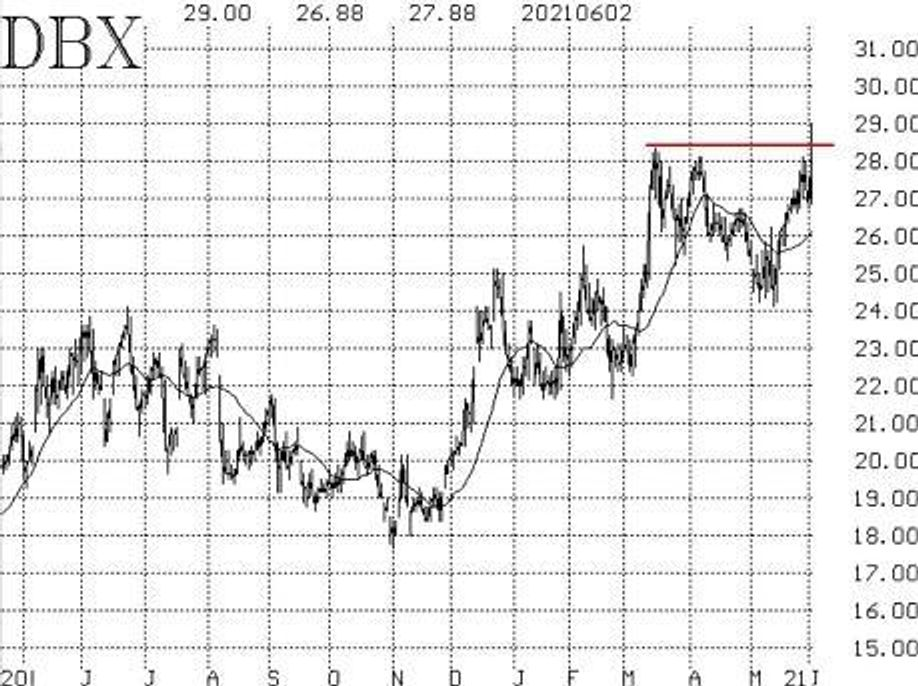
Another stock with heavy option activity has been DropboxDBX,+1.06%.The activist investor Elliot Group has taken a stake and will push the company to pursue strategies that increase its stock price in the short term. One rumor is a merger with rival BoxBOX,+1.78%.
Dropbox probed up to a three-year high on the news, but then fell back. So we are going to use a contingent recommendation here also:
IF DBX closes above 28.50, THEN buy 4 DBX July (16th) 28 calls
If these calls are bought, we will hold without a stop initially and see if the activist investor can accomplish something.
All stops are mental closing stops unless otherwise noted.
Long 2 SPY June (11th) 410 puts and short 2 SPY June (11th) 385 puts:This trade was taken because of the MVB sell signal that occurred, when SPX traded down through 4105 on May 12. It would be stopped out by SPX once again closing above the +4σ Band, which is at 4320 and moving sideways. The signal would reach its profit target if SPX trades at the -4σ Band. Right now, the lower Band is at about 4020 and moving sideways. Sell half of this position if SPX trades at 4000 at any time.
Long 1 SPY June (18th) 420 put and short 1 SPY Jun (18th) 400 put:This recommendation is based on the equity-only put-call ratio sell signal that is in place. We will hold this recommendation as long as the equity-only put-call ratios are on sell signals. Hence, we will be updating the status weekly. Roll the position down, 20 strikes on each side, if SPY trades at the lower strike at any time.
Long 3 DUK June (18th) 100 calls:Hold without a stop while we wait for the activist investor to produce a positive result.
Long 2 SPY June (18th) 415 calls and short 2 SPY June (18th) 428 calls:This spread was bought when the most recent VIX “spike peak” buy signal was confirmed on May 21. It would be stopped out if VIX were to return to spiking mode – that is, if it rose at least 3.00 points over any three-day or shorter period (using closing prices).
Long 1 KSU Jun (18th) 300 call:Kansas City SouthernKSU,-0.14%has formally accepted the higher takeover bid from Canadian NationalCNI,+0.66%.The deal is for $200 cash + 1.129 shares of CNI. So, with CNI at 112, the deal is worth $326. Of course, there will be regulatory delays. We are going to hold to see if this spread can tighten somewhat. It is unclear whether or not Canadian PacificCP,-0.14%—the other bidder – will come back with a superior offer or not. Finally, stop out the calls if CNI closes at 108 or lower.
Long 1 SPY July (16th) 420 call and long 1 SPY July (16th) 420 put:This long straddle is in anticipation of SPX making a volatile move away from the 420 level. If SPXtradesat 437, roll the calls up from the 420 strike to the 437 strike (or the closest strike to that). Conversely, if SPX trades at 403, roll the puts down to the 403 strike.
Long 4 CERN June (18th) 80 calls:Hold without a stop while takeover rumors persist.