


TSLA: How to spot a top 特斯拉顶部初显
2023/7/27:
Yesterday, TSLA broke through the previous day's low, indicating the first downward range confirmed and the second downward movement would start.
昨天,特斯拉跌破前天最低点,图形上第一浪下跌已经确认,第二浪下跌即将开始。
1. First downward movement started from 19/07/2023.
As below chart showing , TSLA encountered the 125% resistance level on 19/07/2023, thus started to decline. However, it gained a support at the 87.5% level and rose to the 100% resistance level.
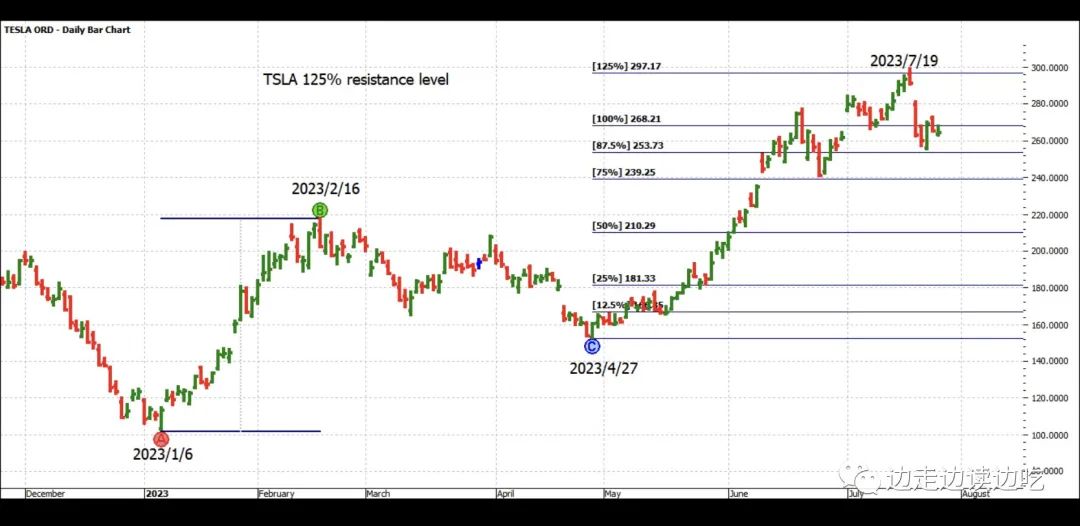
上图显示,特斯拉在2023/7/19遇到125%阻力位下跌,在87.5%位置获得支撑上升(此时第一浪下跌完成)。但是,当它昨天又下跌且跌破前天最低点时,它就开始了第二浪下跌(下面这幅趋势图更为直观)。
2 Yesterday TSLA broke through the low of the previous day, thus confirming the downward trend.
As the below chart is showing , the tops are formed. If TSLA declines below the pink line , the lower low will be confirmed.
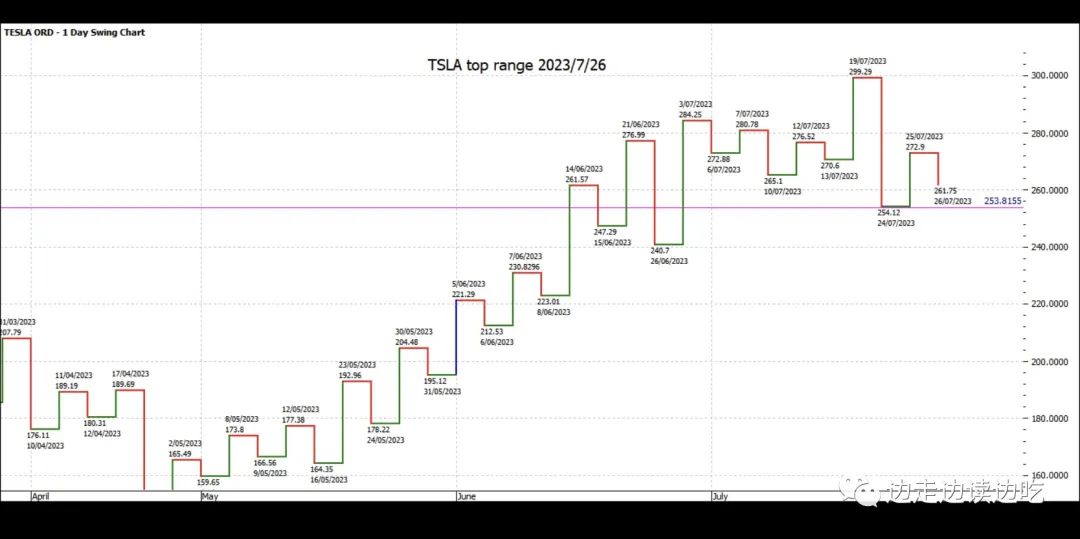
上图显示,特斯拉的一排头部已经形成,只要下跌穿过粉色线,就是确定第二浪下跌。
免责声明:上述内容仅代表发帖人个人观点,不构成本平台的任何投资建议。
