


USDX: trending down / GBP: trending up / 美元指数跌英镑纳指升
2023/8/29:
USDX has fallen below yesterday's lowest point today, confirming that the uptrend has turned into a downtrend, and the trend's arrow has shifted downwards. Meanwhile, GBP/USD has also broken through yesterday's highest point today, confirming an upward trend.
美元指数今天跌破昨天最低点,证实上升趋势已经转为下跌,因为趋势箭头已经向下了。同时,英镑和纳指突破了前一日的最高点,从跌势转升。
1. USDX encountered the resistance from the beginning of 2nd decline.
美元指数遭遇第二跌浪起始点的压力。
The chart below is showing that
→ 1st downtrend from 08/03/2023 to14/04/2023.
→ the 2nd decline started from 31/05/2023 to 18/07/18.
→the 2nd decline was nearly 100% equal the 1st decline.
→ USDX formed a double bottom on 18/07/2023, and started to rebounce.
→Last Friday, USDX nearly reached the same high of 31/05/2023 which is the beginning of the 2nd decline.
→However, the beginning of 2nd decline formed a strong resistance level.
→By trading below yesterday's low, USDX confirmed that it encountered this resistance.
→Yesterday, USDX performed as an "inside day" that it didn't give up or dawn direcion. But today, it gives the downtrend direction.
→Element of time: time of tops are equal, from 08/03/2023 to 31/05/2023, totaal 84 days. To the next top 25/08/2023, 85 days .
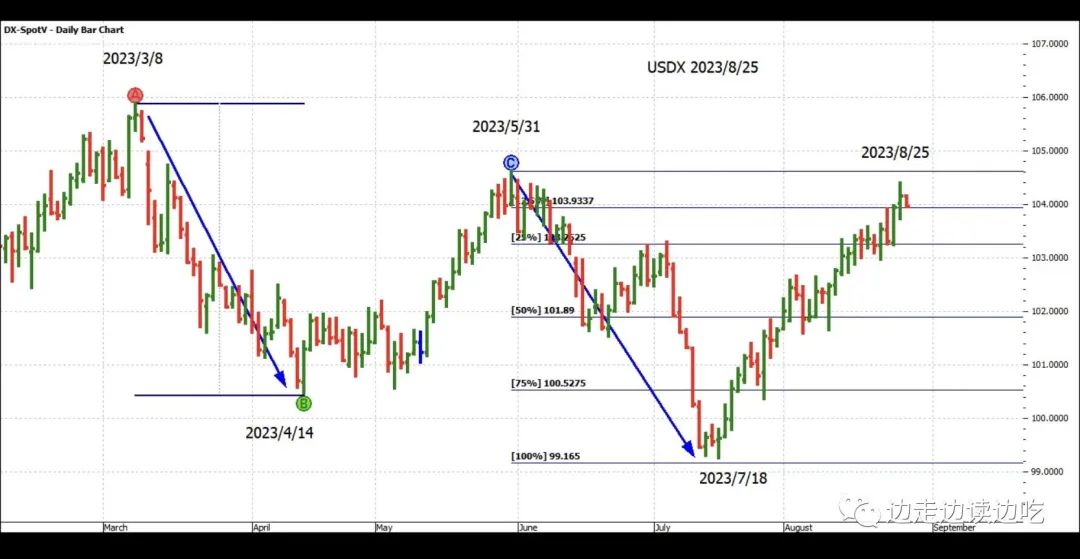
上图显示:
→美元指数近期第一浪下跌从2023/3/8到2023/4/14 。
→第二浪下跌从2023/5~31到2023/7/18 。
→第二浪几乎100%等于第一浪幅度。
→美元指数在7月14日和18号形成双底上升。
→上周五,美元指数接近2023/5/31前期高点。
→别忘了,这是下跌第二浪的起点,所以有巨大阻力。
→今天美元指数跌破昨天最低点,证实了第二浪起点阻力。
→因为昨天美元指数上下两头都没有突破,所以没有给出方向,仅仅在今天才给出方向。
→时间之窗:请注意它的顶部时间相等,也就是说从2023/3/8到2023/5/31共84天,从6月1日到8月25共85天。
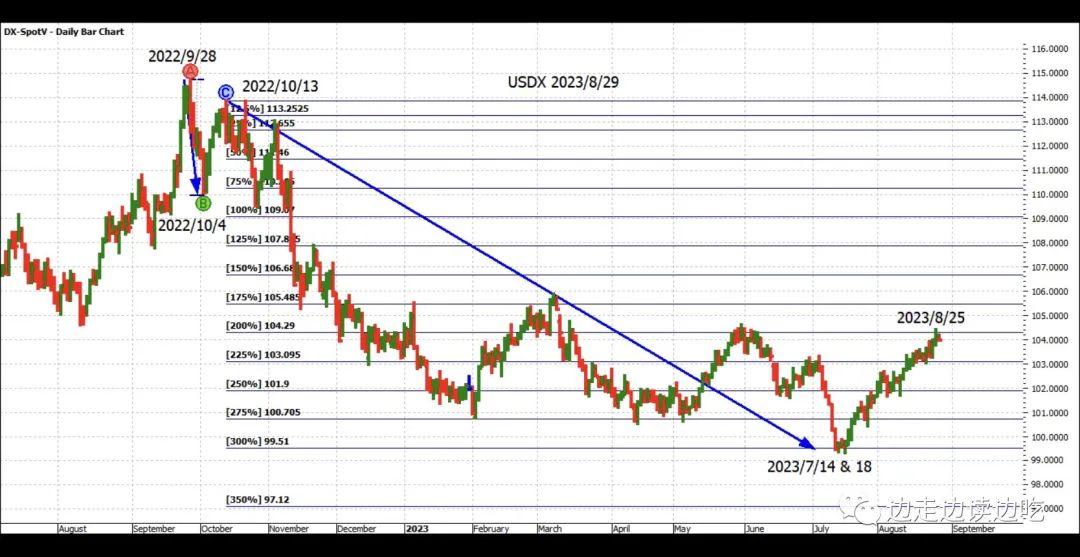
2. USDX also encountered 200% resistance level from 13/10/2022.
美元指数同时遭遇2022/10/13下跌浪的200%阻力。
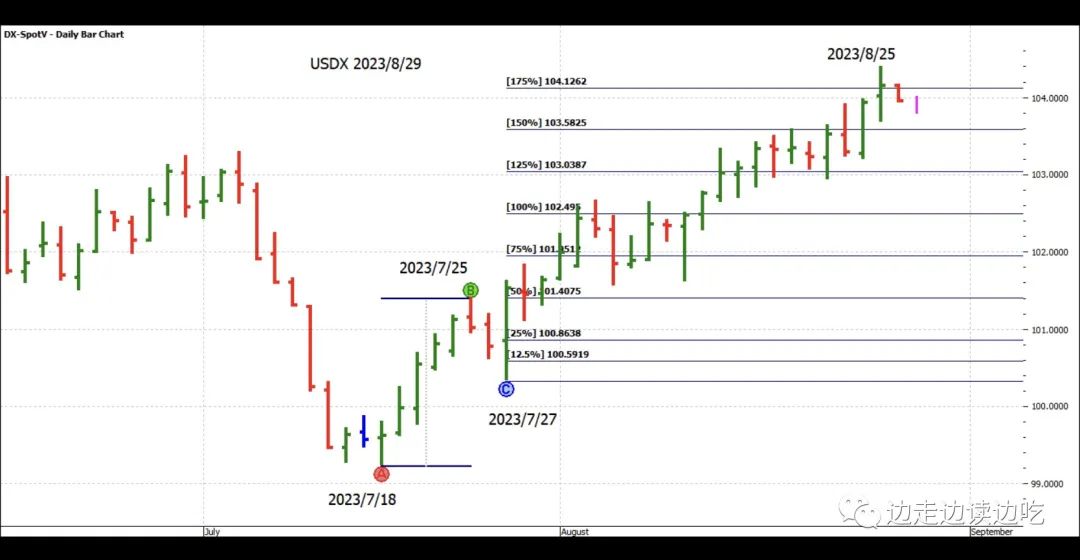
3. From upside, USDx encountered 175% resistance.
从上升方面看,美元指数遇到175%阻力。
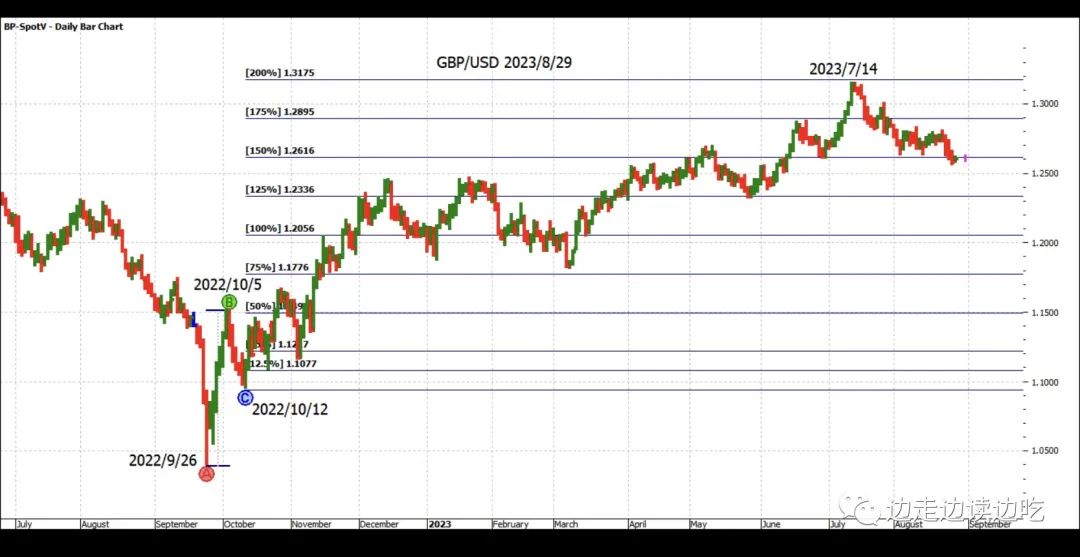
4. Meanwhile , GBP//USD rebounced from 150% support level.
在美元指数下跌同时,英镑从150%支撑位反弹上升。
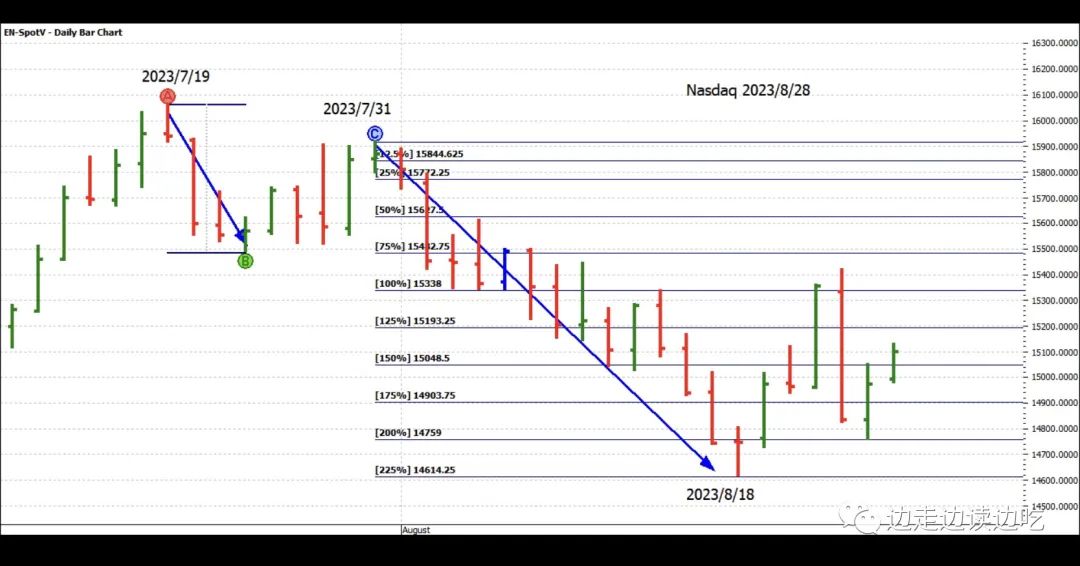
5 Nasdaq confirmed double bottom up by breakingthrough last Friday's highest point.
纳斯达克综合指数昨日也突破上周五最高点,显示双底支撑成立。
免责声明:上述内容仅代表发帖人个人观点,不构成本平台的任何投资建议。
