
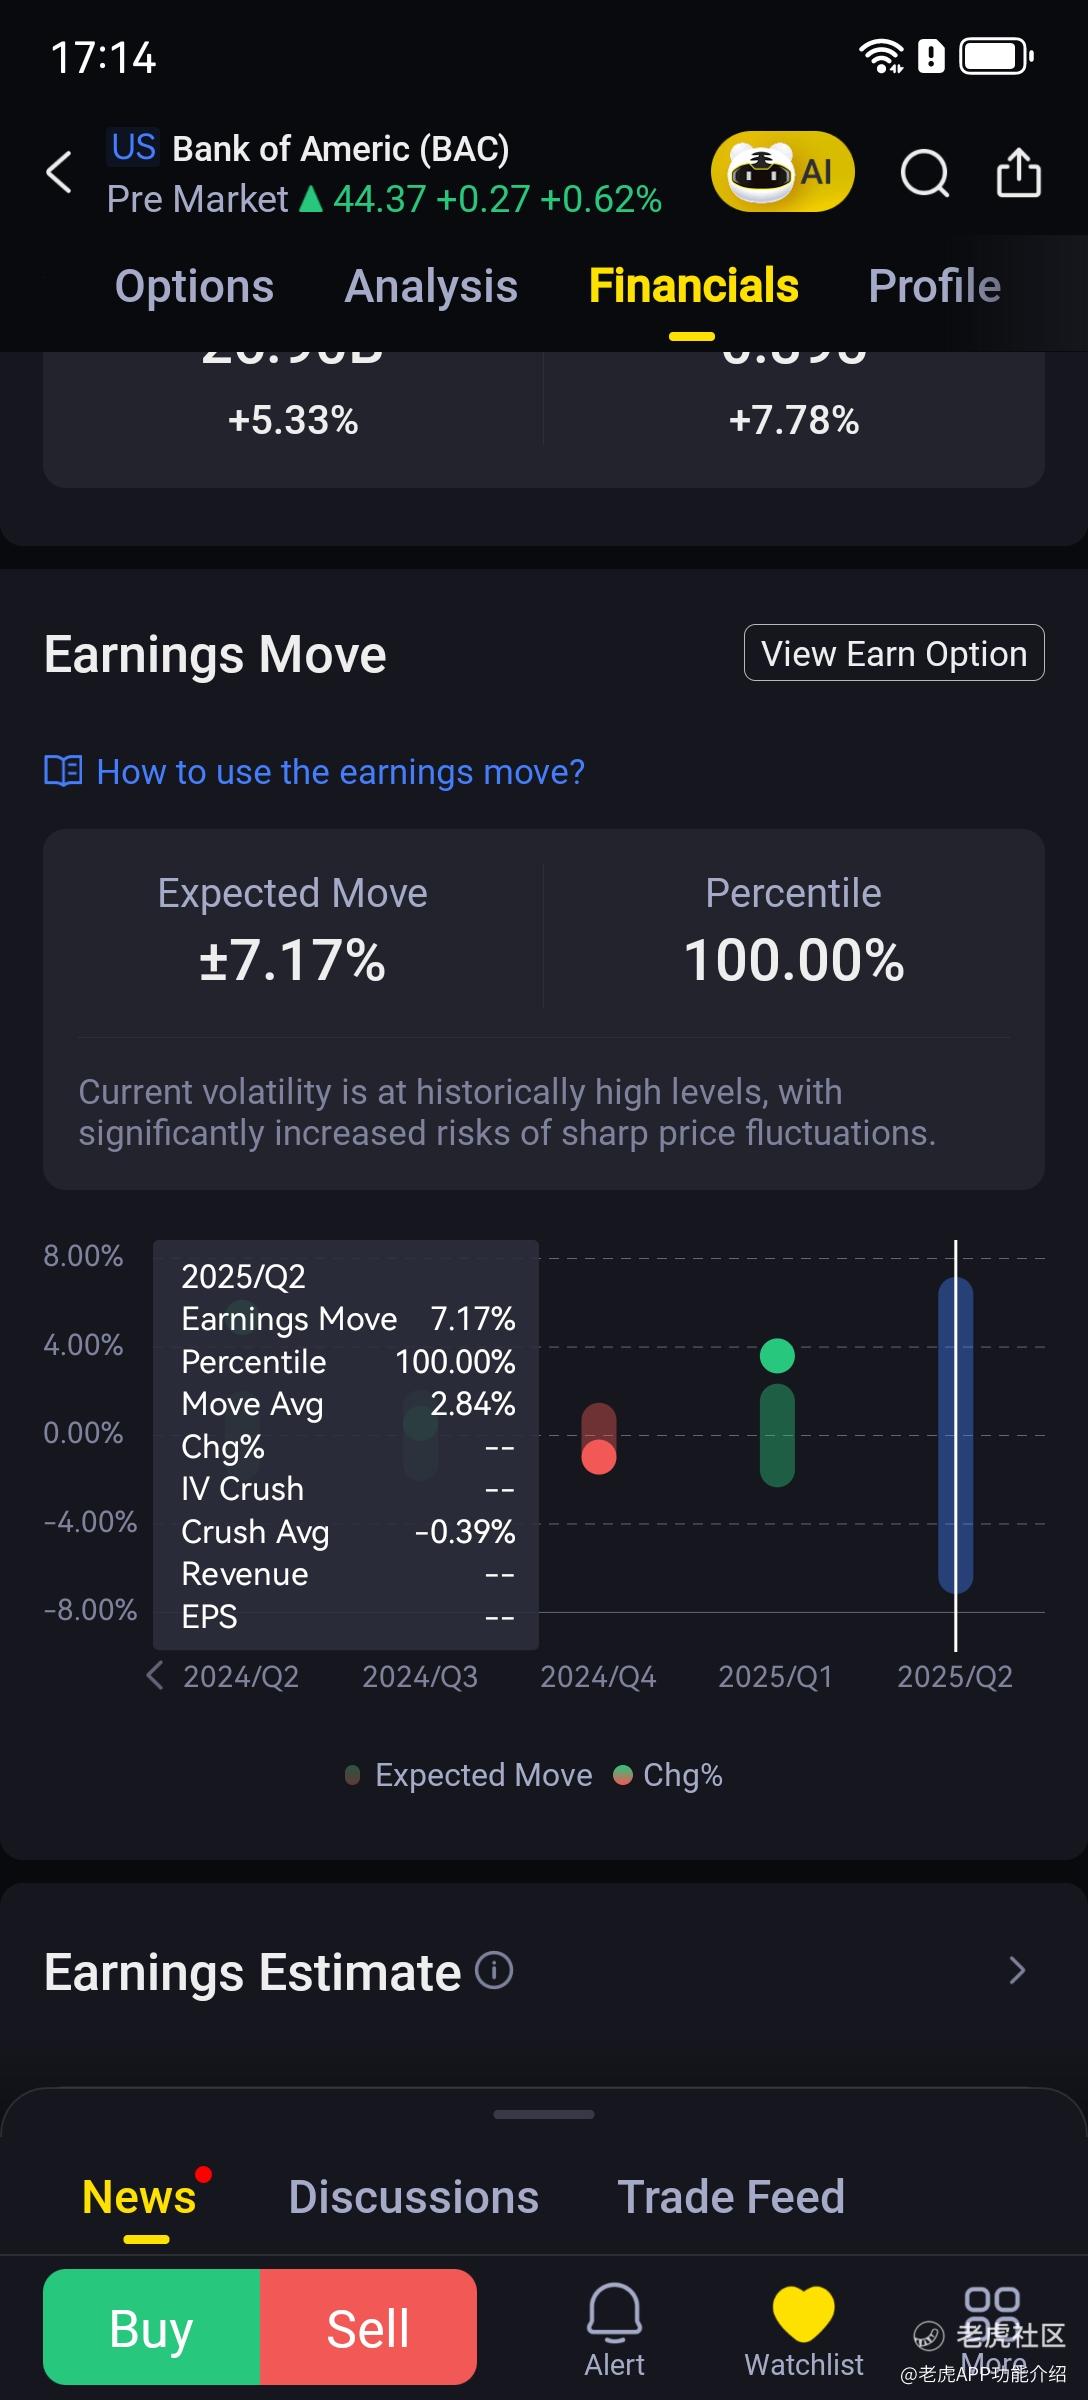
How to use the earnings move?
Earnings earnings move is a tool that quantifies market volatility expectations before earnings announcements based on indicators such as forecasted volatility, historical averages, and percentile values. It quickly identifies overestimated/underestimated volatility states and simplifies the comparison between forecasted volatility metrics and historical data, helping investors capture volatility pricing discrepancies during earnings events, avoid excessive volatility risks, and achieve efficient event-driven trading without complex models.
I. Core Indicator Definitions
Forecasted Volatility (At-the-Money Option Price Ratio)
-
Definition: The ratio of at-the-money option price to the underlying stock price, reflecting market expectations for short-term volatility.
-
Calculation: Forecast Volatility = Straddle Option Price Near Current Price / Stock Price * 100%
-
Example:
Stock price 100, straddle option price = 6 → Forecast Volatility = 6%;
Interpretation: The higher the ratio, the greater the market's expected volatility.
Historical Average (Forecast Volatility Mean)
-
Definition: The average of forecast volatility levels during the past N earnings announcement periods.
-
Example: When the average forecast volatility ratio was 5% for the past 5 earnings periods, and the current ratio is 8% → significantly above historical levels.
Exceeds Historical (Forecast Volatility Percentile)
-
Definition: The relative position of current implied volatility within historical datasets (e.g., past 20 earnings report data points).
-
Example: Historical 80th percentile value = 7%, current ratio = 8% → Current value exceeds historical 80th percentile (at extreme high level).
II. Trading Strategy Reference
Approach 1: Assessing whether volatility is overestimated
Conditions:
Current ratio > 90th percentile of historical values (e.g., historical 90th percentile = 7%, current = 8%);
Current ratio > 2 times historical average (e.g., historical average = 4%, current = 8%).
Strategy selection:
Shorting Volatility: Selling Straddle
Rationale: The market has overpriced volatility, with high probability of implied volatility ratio declining post-earnings.
Direction 2: Predicting Stock Price Movement
Conditions:
Historical performance bias: If the stock has risen 4 out of the past 5 earnings reports with an average gain of +5%;
Strategy selection:
Directional trading: Buy call/Sell put options, or go long stocks.
III. Q&A
Why might the predicted volatility ratio calculated from at-the-money option prices near earnings dates be more practical compared to implied volatility (IV)?
-
Simple and intuitive, no complex models required:
Directly using the ratio of at-the-money option price/stock price eliminates IV calculations, making it suitable for manual operations or individual investors lacking professional tools.
-
Reflects genuine market trading sentiment:
The ratio directly reflects the "premium" that the market is willing to pay for at-the-money options, especially before earnings announcements, when liquidity concentrates in at-the-money options, making their prices more representative of the market's pricing of short-term volatility.
-
Mitigating model assumption risks:
It does not rely on the assumptions of option pricing models, avoiding misjudgments caused by model errors (such as incorrect risk-neutral probabilities).
-
Suitable for short-term event trading
The core of earnings day trading lies in capturing the post-event volatility collapse (IV Crush), with at-the-money options (particularly near-month options) being most sensitive to such events. For example: when the price ratio of at-the-money options surges to 8% pre-earnings (historical average 4%), it directly indicates overestimated volatility, enabling straightforward short volatility decisions without complex calculations.
-
Avoiding model errors
During earnings periods, markets may experience extreme volatility that renders IV models ineffective (e.g., liquidity drying up, bid-ask spreads widening). In such scenarios, the at-the-money options price ratio proves more stable as it solely reflects actual transaction prices.
Appendix: How to Quickly Check Which Companies Are Releasing Earnings Reports?
Search - Enter "Calendar" to Quickly Locate and View

修改于 2025-08-06 20:27
免责声明:上述内容仅代表发帖人个人观点,不构成本平台的任何投资建议。
